Written by: Doug Camplejohn, CEO & Co-Founder, Coffee | Last updated: September 21, 2026
Key Takeaways
- Salesforce pipeline health blends activity, velocity, and data quality signals to show whether open opportunities will convert to revenue.
- Six core metrics create a repeatable way to measure pipeline health: coverage ratio, activity recency, next-step coverage, stage aging, close-date slippage, and deal concentration.
- Manual logging captures less than 28% of sales activities, which quietly corrupts downstream metrics and makes dashboards unreliable.
- Automatic activity capture from email, calendar, and call transcripts delivers the single highest-impact improvement to CRM hygiene for most organizations.
- Coffee keeps the pipeline health dashboard aligned with reality by automatically logging activity to the correct Salesforce records.
What Salesforce Pipeline Health Actually Measures
Salesforce pipeline health combines three signal types: activity, velocity, and data quality. Together, they indicate whether open opportunities will convert to revenue in the forecast period. A healthy pipeline carries enough qualified, active deals to cover the quota target, typically 3x–5x Of The Revenue Target as a starting point derived from win-rate math. Each deal should show recent buyer engagement, a dated next step, and a close date grounded in buyer-confirmed activity rather than rep optimism.
How To Measure Sales Pipeline Health In Salesforce With Six Core Metrics
Each metric below pairs a clear definition with a concrete implementation. Every section names the report type, the object or field logic, and the formula pattern so you can rebuild it without custom code.
Coverage Ratio
Coverage ratio is the total value of open, in-period pipeline divided by the revenue target for that same period. It shows whether the team has enough opportunity volume to hit the number given its historical win rate.
Implementation: Build a summary-format report on the standard Opportunities report type, grouped first by Owner and then by Stage. Add a custom summary formula that divides the summed Amount by the quota target. Five Filters Keep The Ratio Honest. Set Close Date to the current fiscal quarter, Opportunity Status to Open, Last Stage Change Date within the last 90 days, Amount greater than zero, and Record Type to revenue-bearing types only. An Opportunity With Four Product Line Items Returns Four Rows And The Amount Column Sums Four Times, so avoid report types that join opportunity products or activities. That mistake alone can double the reported ratio. The required coverage ratio is the inverse of the win rate: A 30% Win Rate Requires Roughly 3.3x Coverage, While A 20% Win Rate Requires 5x. A team-level ratio of 3.4x can hide one rep at 6x and another at 1.2x. The summary formula produces one ratio per grouping rather than a blended figure, which gives the correct read.
Activity Recency
Activity recency measures how recently a logged, buyer-side interaction occurred on each open deal. It separates deals with live engagement from deals that are quietly stalling.
Implementation: Build a report on the Opportunities object with a formula field that calculates the number of days since Last Activity Date (TODAY() minus Last Activity Date). Flag thresholds by segment as starting points: SMB Deals Flag At 14–21 Days Without Logged Activity, Mid-Market At 30–45 Days, And Enterprise At 60–90 Days, Adjusted By Stage. Treat these as operational starting points rather than universal rules. Note that The Pipeline Inspection Activity Heatmap Does Not Track Or Count Manually Created Or Manually Logged Tasks Such As To Do List Items, so the Last Activity Date field only reflects the logging discipline behind it.
Next-Step Coverage
Next-step coverage measures the share of open pipeline value that carries a concrete, dated next action. A deal without a next step does not belong in the forecast.
Implementation: Build a report on Opportunities filtered to open deals where Next Step is blank OR Next Step Date is null. Add a custom summary formula that calculates the percentage of total open pipeline value that lacks a dated next step: (SUM(Amount where Next Step is blank) / SUM(Amount)) × 100. Every Deal Should Carry A Next Step With A Date, And Anything Idle Past A Set Threshold — 30 Days For Most Mid-Market Motions — Should Be Closed Out Or Requalified.
Stage Aging
Stage aging measures how long each deal has sat in its current stage relative to the historical median for that stage. Deals Exceeding 1.5x–2x The Stage Median Warrant Review; Deals Exceeding 2x–2.5x Warrant Escalation.
Implementation: Use the Opportunity History Report Type — Standard But Hidden By Default In The New Report Picker; Pin It To Frequently Used. Add columns: Opportunity Name, Stage at Save, From Stage, To Stage, Created Date, Created By, Amount at Save. Calculate time-in-stage by subtracting the Created Date of one OpportunityHistory record from the next. Three practical limits apply. Very Old Deals May Require Direct SOQL Because The Standard Report Type Only Surfaces Recent Records Cleanly; Orgs With Millions Of Opportunities Can Hit Report Row Limits Without Tight Created Date Filtering; And The One-Row-Per-Save Rule Means A Single Save Changing Both Stage And Amount Creates One Row, Not Two, Requiring Inference Of The Causing Field From Value Differences. Compute stage medians from 12 months of closed opportunities, both won and lost, because a won-only median skews optimistic.
Close-Date Slippage
Close-date slippage tracks how many times and by how much a deal's close date has moved out of the committed period. Repeat slippage is a stronger negative predictor than a single push.
Implementation: Query OpportunityHistory using the PrevCloseDate field. From API Version 50.0 (Winter '21) Onward, OpportunityHistory Includes A PrevCloseDate Field Holding The Close Date Before The Update; The Field Is Null On Rows Created Before Winter '21. Filter by CreatedDate for the period and keep rows where PrevCloseDate and CloseDate fall in different periods to produce the slippage numerator. Two documented limitations apply. An OpportunityHistory Record Is Deleted With Its Parent Opportunity, So Deleting Deals Erases The Evidence That They Ever Slipped. For the native Pipeline Inspection Push Count field, It Tracks Only Close Dates Pushed Past A Calendar Month, Never Nets Out Pull-Ins, And Is Hidden By Default Behind The Gear Icon's Select Fields To Display. A single push is normal. Two pushes are a warning. Three Or More Is A Strong Negative Predictor And Should Trigger A Mandatory Documented Review Rather Than A Silent Date Change.
Deal Concentration
Deal concentration measures how much of the total open pipeline value sits in a small number of accounts or single-contact deals. High concentration creates forecast fragility.
Implementation: Build a report on Opportunities grouped by Account Name and sorted descending by Amount. Add a custom summary formula that calculates each account's share of total open pipeline: SUM(Amount per Account) / SUM(Amount overall) × 100. Flag single-threaded deals, meaning those with only one associated contact, above a defined ACV threshold. Single-Threaded Deals Above A Defined Threshold (For Example, $25,000 USD) Are A Single Point Of Failure If That Contact Changes Roles, Leaves, Or Stops Returning Calls.
Step-By-Step: Assembling The Salesforce Pipeline Health Dashboard
The six source reports feed a single dashboard that surfaces pipeline health at a glance. Build each component from its named source report and place it according to the layout below.
- Coverage-Ratio Gauge (Top-Left): Source: the summary Opportunities report with the custom summary formula. Component type: gauge. Set the green threshold at your win-rate-derived target (for example, 3x for a 33% win rate), yellow below that, and red below 2x.
- Slippage Trend Line (Top-Left, Below Gauge): Source: the OpportunityHistory PrevCloseDate query. Component type: line chart. Plot slippage count and value week over week for the current quarter.
- Stage-Aging Bar Chart (Top-Right): Source: the Opportunity History report. Component type: horizontal bar chart grouped by stage. Bars represent average days-in-stage. Overlay the 1.5x median threshold as a reference line.
- Deal-Concentration Table (Top-Right, Below Bar Chart): Source: the Account-grouped Opportunities report. Component type: table. Show Account Name, Open Pipeline Value, and % of Total Pipeline, sorted descending.
- Activity-Recency Heatmap (Bottom Row): Source: the Opportunities report with the days-since-last-activity formula field. Component type: matrix or table with conditional highlighting. Color-code by segment threshold (green, yellow, red).
- Next-Step Coverage Metric (Bottom Row): Source: the Next Step blank filter report. Component type: metric component that shows the percentage of pipeline value without a dated next step.
Lightning Dashboards Cover About 80% Of What Most Sales Orgs Need; CRM Analytics Is Worth The Investment Only For Cross-Object Trending, Predictive Models, Or External Data Sources. Before you build, confirm which platform you will use. For a 50–200 person SaaS org running a weekly pipeline review, Lightning Dashboards are the right starting point.
Who Owns Pipeline Health
Pipeline health works best as a shared responsibility across three roles. No single function owns all of it, and gaps appear when responsibilities blur.
- RevOps (Accountable): Owns the report infrastructure, filter logic, threshold calibration, and dashboard configuration. RevOps ensures the Opportunity History report type is pinned, the PrevCloseDate query is scheduled, and the coverage formula references the correct quota denominator. The team also recalibrates stage-aging medians quarterly from a trailing 12-month window of closed won and lost deals.
- Sales Managers (Responsible): Own the weekly inspection cadence and the coaching conversation against each metric. Managers escalate deals that have tripped the aging threshold twice without advancing and document the reason when a close date moves.
- Reps (Consulted/Informed): Own the accuracy of the inputs that the dashboard reads: stage, close date, next step, and contact association. A rep who advances a stage without a buyer-confirmed action corrupts every downstream metric the dashboard displays.
The Data-Quality Precondition: Why Manual Logging Corrupts Every Metric
Every metric above depends on activity data that manual logging structurally cannot provide at sufficient completeness. Manual Logging Captures Less Than 28% Of Sales Activities, Meaning More Than 72% Of The Activity Record Is Missing Before Reporting Even Begins. That gap corrupts each metric in specific and silent ways.
- Coverage Ratio inflates first because stale deals with no real buyer engagement remain in the open pipeline. Across Customer Data, 10% Or More Of Open Pipeline Has Not Been Touched In 12 Months, yet those deals still add to the amount column.
- Activity Recency then reads as healthier than reality. A deal where the rep sent three unanswered emails shows a recent Last Activity Date even though no buyer-side engagement occurred. Partial Activity Capture Is Worse For Reporting Than No Capture: An Empty Timeline Prompts Someone To Ask, While A Half-Full One Reads As Complete And Produces Confident Numbers That Are Wrong In Ways Nobody Can See.
- Next-Step Coverage understates the problem for the same reason. Reps who do not log meetings do not log next steps from those meetings. The report shows blank next-step fields as a data gap when the actual issue is a missing activity record.
- Stage Aging degrades separately when reps advance stages to reset the aging clock rather than because a buyer-confirmed milestone was reached. If Time-In-Stage Triggers The Flag, Reps Will Bounce Deals Between Stages To Reset The Counter.
The fix is automatic activity capture: Automatic Activity Capture — Ingesting Every Email, Meeting, And Call And Matching It To The Right Account, Opportunity, And Contact — Is The Single Highest-Impact Hygiene Improvement Most Organizations Can Make. That approach removes the dependency on rep memory and end-of-day data entry.
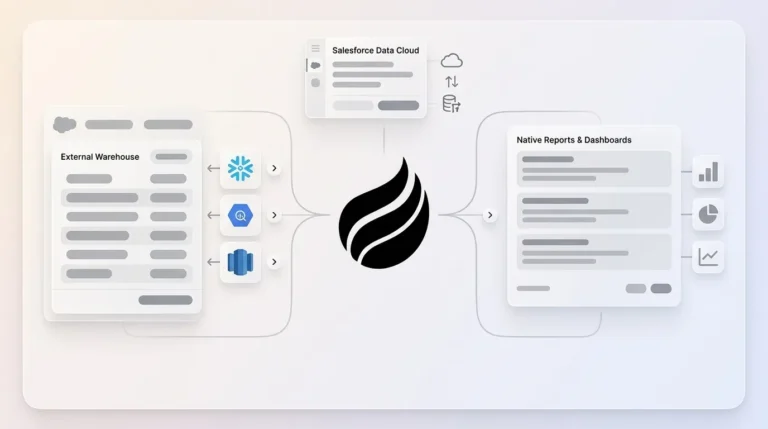
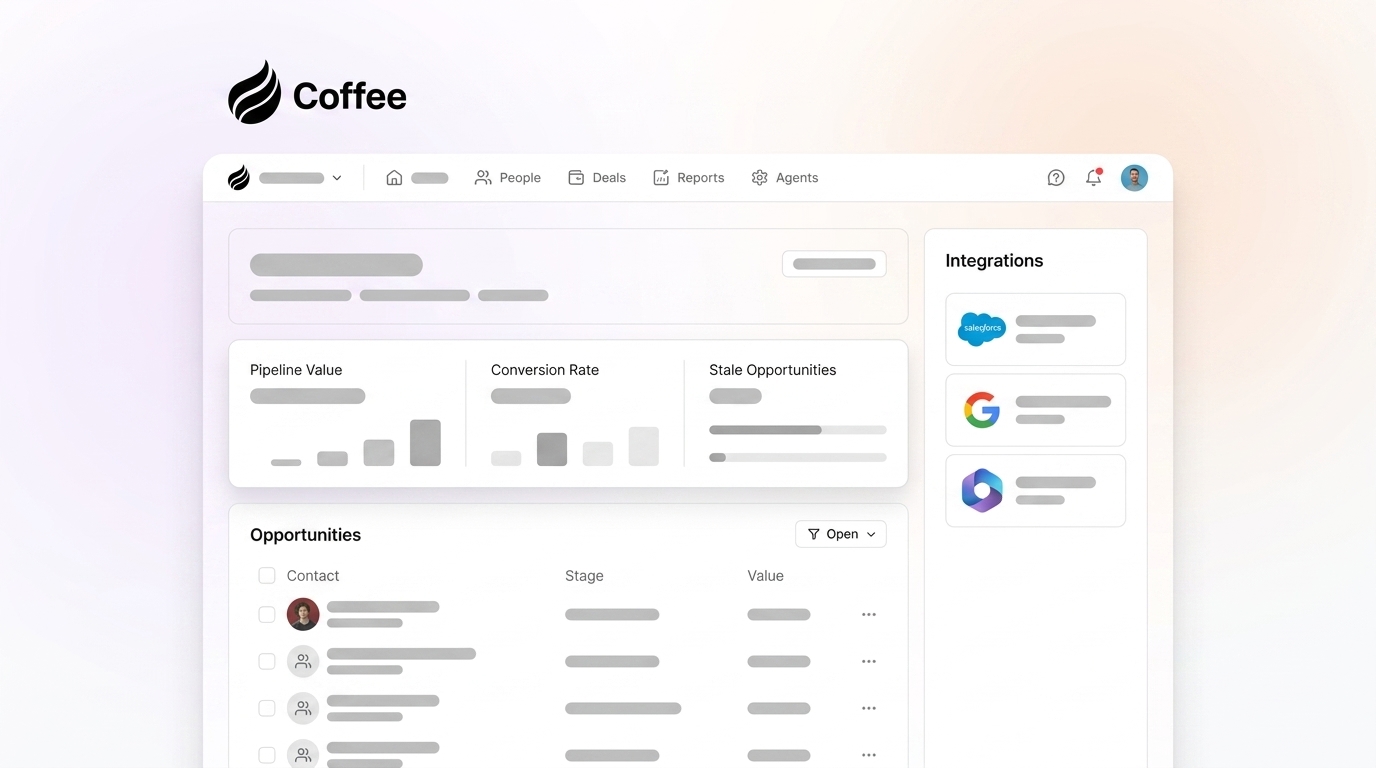
The Coffee Agent, deployed as a Companion App on top of Salesforce, captures and logs activity from email, calendar, and call transcripts automatically. It writes interactions back to the correct Opportunity and Contact records without rep input. The pipeline health dashboard's numbers reflect reality only when the activity layer underneath them is complete. Coffee handles that layer so the dashboard can be trusted.
Automate Activity Capture With Coffee
Salesforce Pipeline Inspection Vs. Custom Reports
Salesforce's Pipeline Inspection is an interactive workspace that consolidates open opportunities, forecast category totals, recent deal changes, activity indicators, and deal-level signals in a single view. It works well for a quick deal-level scan, but it cannot replace the custom reports described above. The table below shows where Pipeline Inspection falls short on the four capabilities this dashboard depends on.
| Capability | Pipeline Inspection | Custom Reports |
|---|---|---|
| Coverage Ratio Calculation | No, In Salesforce Pipeline Inspection, formula fields cannot be used as summary fields | Yes, custom summary formula on Opportunities report type |
| Historical Snapshots | Limited, Native Historical Trending Is Capped At A 90-Day Window | Yes, Opportunity History report type with date filtering |
| Scheduled Delivery | No, Pipeline Inspection Has No Scheduled Delivery | Yes, standard Salesforce report subscriptions |
| Custom Report Types | No, Pipeline Inspection Does Not Support Custom Report Types | Yes, full custom report type builder |
Pipeline Inspection Charts Do Not Show Data When A Search Returns 2,000 Or More Opportunity Records. For orgs above that threshold, custom reports provide the only reliable path. The Trailhead module Understand Pipeline Health with Metrics and Charts covers Pipeline Inspection's two main metric groups, forecast categories and pipeline changes, along with the Chart tab's waterfall and flow charts.
The Weekly Review Cadence
The dashboard works best as a pre-read rather than a slide deck. The Weekly Review Meeting Should Run 30–45 Minutes For A Manager With Five To Eight Direct Reports, with the dashboard open and each metric driving a specific question.
- Coverage Ratio: Focus on "What is our coverage ratio by rep, and who is below the win-rate-derived target?" Reps below 3x (as a starting point for a ~33% win-rate team) need a pipeline generation conversation rather than a deal inspection.
- Activity Recency: Ask "Which deals have no logged activity in 14 days (SMB) or 30 days (mid-market)?" Flag these before you discuss stage or close date.
- Next-Step Coverage: Review "Which deals above our ACV threshold have no dated next step?" Any deal that cannot produce a concrete next action with a date belongs in the stale bucket.
- Stage Aging: Check "Which deals have exceeded 1.5x the stage median?" Treat these as yellow flags. Deals exceeding 2x are escalation candidates.
- Close-Date Slippage: Look at "Which deals have slipped more than once this quarter?" A Flagged Opportunity Cannot Survive Two Consecutive Reviews In The Same State — It Must Advance With A Dated, Buyer-Confirmed Next Step, Push With A Written Reason, Or Close.
- Deal Concentration: Identify "Which accounts represent more than 20% of open pipeline, and are those deals multi-threaded?"
Frequently Asked Questions
What Is A Salesforce Pipeline?
A Salesforce pipeline is the collection of open Opportunity records in a Salesforce org, each representing a potential revenue transaction at a defined stage of the sales process. The pipeline is the primary input to revenue forecasting. It shows how much potential revenue exists, at what stage, owned by which rep, and expected to close in which period. Pipeline health refers to the quality and reliability of that collection, not just its total value.
What Are The Stages Of A Sales Pipeline?
Sales pipeline stages vary by organization, but a common five-stage B2B structure, per Salesforce, is Prospecting, Qualification, Meeting/Demo, Proposal, and Negotiation, followed by Closing. Some teams instead use Prospecting, Discovery, Proposal, Negotiation, and Closed Won or Closed Lost. Salesforce admins configure stage picklist values and map each stage to a forecast category. That mapping determines how each stage contributes to the revenue forecast roll-up.
How Often Should A Pipeline Health Dashboard Be Reviewed?
Activity recency and deal age should be checked weekly, ideally as a pre-read before the pipeline review meeting. Coverage ratio and stage conversion should be reviewed monthly. A full data completeness audit, covering field completion rates, contact association, and close-date accuracy across all open deals, should run quarterly. In The Final Two Weeks Of A Quarter, Coverage And Slippage Metrics Warrant Daily Review because the denominator (remaining quota) is shrinking while the pipeline is still moving.
Why Does My Coverage Ratio Look Healthy But The Quarter Still Misses?
A coverage ratio can look healthy while the underlying pipeline remains unreliable for three reasons. Stale deals with no recent activity inflate the numerator. Close dates are aspirational rather than buyer-confirmed. The ratio is blended across reps rather than broken out per owner. A Team-Level 3.5x Ratio That Hides One Rep At 6x And Another At 1.2x Is Not A Healthy Pipeline — It Is An Averaging Problem. The five filters described in the Coverage Ratio section above, covering stage change recency, amount greater than zero, revenue-bearing record types, open status, and current fiscal quarter close date, remove the most common sources of inflation before the ratio is calculated.
Can The Coffee Agent Work With An Existing Salesforce Instance?
Yes. Coffee's Companion App deploys as an intelligent layer on top of an existing Salesforce installation. A simple authentication allows the Coffee Agent to sync data from sources like emails, calendars, and transcripts, enrich it, and write valuable insights back to the primary CRM. No migration is required. The existing Salesforce configuration, including stages, record types, forecast categories, and validation rules, remains in place. Coffee handles the data-in layer so the pipeline health dashboard reflects what is actually happening in deals, not what reps remembered to log.
Conclusion: The Dashboard Is Only As Good As Its Inputs
The six metrics above are the settled vocabulary of pipeline health. The build described in this guide gives RevOps, sales managers, and Salesforce admins the exact report types, objects, formula patterns, and dashboard layout to make those metrics visible this week.
Every metric is only as reliable as the activity data feeding it. As noted earlier, manual logging leaves the majority of the interaction record missing before reporting even begins. A dashboard built on that foundation displays clean charts built on unreliable data.
The Coffee Agent solves the data-in problem at the source. By automatically capturing emails, calendar events, and call transcripts and logging them to the correct Salesforce records, Coffee ensures the pipeline health dashboard reflects the actual state of every deal without depending on rep discipline, validation rules, or end-of-day logging sessions. Coffee turns the build guide into a trustworthy operating system for pipeline health.
Trust Your Pipeline Data With Coffee