
Written by: Doug Camplejohn, CEO & Co-Founder, Coffee | Last updated: September 9, 2026
Key Takeaways for Reliable Deal Monitoring
- Deal progression monitoring tracks opportunities through pipeline stages to spot stalls, velocity issues, and forecast risks before they impact revenue.
- Pipeline Inspection and Sales Path work together as Salesforce’s native workspace for live deal reviews, change metrics, and clear stage guidance.
- Core metrics include stage duration, win rate, stalled deals, pipeline velocity, and forecast accuracy so leaders can trust pipeline data.
- A simple weekly routine using Pipeline Inspection and list views keeps monitoring consistent and surfaces at-risk opportunities faster.
- Coffee automates activity capture and enrichment so monitoring reflects real customer engagement, not manual data entry. Explore Coffee’s pricing to see how it fits your stack.
Set Up Pipeline Inspection for Live Deal Reviews
Pipeline Inspection is Salesforce’s native workspace for reviewing pipeline metrics, deal changes, and AI-driven insights in one place. It acts as the operational hub for deal progression monitoring and is available in Sales Cloud Enterprise and above.
- Navigate to Setup and enter “Pipeline Inspection” in Quick Find.
- Open the Pipeline Inspection Setup page and toggle the feature on.
- Verify Opportunity historical trending is enabled, because this powers change metrics.
- Add the Pipeline Inspection button to the Opportunities list view page.
- Assign users the appropriate permission set: Pipeline Inspection, Pipeline Inspection Included, or Revenue Intelligence.
- Configure optional features like Einstein Opportunity Scoring if your org is licensed.
Key configuration options include inspection metrics such as Amount Weighted and Days in Stage, historical trending fields, and Einstein Deal Insights. Pipeline Inspection functions as an interactive opportunity review workspace for live deal reviews and change indicators. Reports and dashboards handle scheduled delivery and broader executive reporting.
Troubleshooting: If change metrics look incomplete, historical trending likely started too recently. Allow time for new changes to accumulate. If a user sees fewer opportunities than expected, check role hierarchy, sharing rules, territories, and record ownership. Users need the permission set plus normal object, record, and field access to see expected opportunities.
Once Pipeline Inspection is active and stable, the next step is configuring Sales Path so reps enter data consistently at every stage.
Configure Sales Path for Clear Stage Guidance
Sales Path provides visual stage guidance on opportunity records, showing reps the key fields and actions required before advancing a deal. It creates stage discipline, which supports accurate deal progression monitoring.
- Navigate to Setup > Object Manager > Opportunity > Path Settings.
- Click New Path and select the Stage field.
- Define the picklist values that appear in the path, aligned to your sales process.
- For each stage, add key fields reps must complete, such as Next Step, Primary Contact Role, and Amount.
- Include guidance text that explains the exit criteria for advancing to the next stage.
- Activate the path and assign it to the appropriate record types and profiles.
Align stages to buyer actions rather than seller activities. For example, use “Evaluating Proposal” instead of “Sent Proposal.” Buyer-centric stages reflect real deal progression and produce more accurate pipeline data.
Troubleshooting: If Path shows a different stage than the record, review Path settings for conditional branching or mapping issues. The Path may have “Enable Path Guidance” or conditional branching configured, which can change what appears under specific conditions.
Key Metrics That Reveal Deal Progression
Clear metrics turn raw opportunity data into a story about deal health. These KPIs show where deals stall, how fast pipeline moves, and whether forecasts match reality.
| Metric | Definition | How to Calculate in Salesforce | Benchmark |
|---|---|---|---|
| Stage Duration (Time in Stage) | Average days an opportunity spends in each stage | Average of (Date Exited Stage − Date Entered Stage) via Opportunity History reports | Flag deals sitting 2× longer than the stage average |
| Win Rate | Closed-won deals as a percentage of total closed opportunities | Closed Won ÷ (Closed Won + Closed Lost) via custom report | 20–21% average B2B, with top performers at 30%+ |
| Stalled Deals | Opportunities with no activity or stage change for a defined period | Report on Last Activity Date vs. Stage Entry Date and filter open opportunities where Last Activity Date is more than 14 days ago | Flag deals with no activity in 10+ days (Weflow) or 14 days (Kubaru) depending on the source |
| Pipeline Velocity | Revenue throughput of the pipeline | (Opportunities × Win Rate × Avg Deal Size) ÷ Cycle Length | Track month-over-month trends. Declining velocity with stable deal count signals stalling |
| Forecast Accuracy | How closely the forecast matched actual results | (Actual Revenue ÷ Forecast Amount) × 100 via Collaborative Forecasts and reporting snapshots | Within 10% is strong, within 5% is excellent |
Pipeline coverage of 3×–5× is the most referenced pipeline KPI in board meetings and forecast calls for B2B SaaS, with enterprise deals typically needing 3×–4×. Build these metrics in Salesforce using custom reports on the Opportunity History object, historical trending fields in Pipeline Inspection, and reporting snapshots for week-over-week trend analysis.
With these metrics defined and calibrated, you can build a weekly review routine that keeps the pipeline honest.
Weekly Pipeline Review Routine That Actually Happens
A simple, repeatable routine keeps monitoring tools from becoming shelfware. The workflow below sequences Pipeline Inspection and list views into a weekly cadence.
- Monday morning: Open Pipeline Inspection and review week-over-week change metrics. Filter by forecast category, such as Commit and Best Case, and by owner.
- Monday review meeting (30–45 minutes): Walk through flagged opportunities in Pipeline Inspection. Use inline editing to update facts confirmed during the meeting. Assign follow-up tasks for items that need customer confirmation.
- Wednesday follow-ups: Use list views to identify stalled deals using the 14-day threshold mentioned earlier. Managers follow up with reps on specific opportunities.
- Friday updates: Reps update stages, close dates, and next steps before the week ends. Run a custom report on pipeline changes to capture the week’s movement.
Compare Native Salesforce Monitoring to Coffee
Native Salesforce tools handle basic tracking, and their accuracy depends entirely on manual rep input for logging activities and updating stages. Third-party tools like Coffee automate the data-in process so monitoring reflects real customer engagement.
Native Salesforce tools include:
- Pipeline Inspection: Interactive workspace for live deal reviews, change metrics, and Einstein insights.
- Sales Path: Visual stage guidance that enforces field completion and exit criteria.
- Reports and Dashboards: Scheduled delivery, custom report types, and executive reporting.
Limitations of native tools:
- Depend on reps to log activities, update stages, and maintain data quality.
- Einstein Activity Capture provides basic email and event sync, and many organizations find it unreliable because activities appear inconsistently and matching logic is opaque.
- Historical depth is a significant blind spot in standard Salesforce analysis, because the platform stores current-state data without built-in access to a complete, queryable history of record changes.
| Capability | Native Salesforce | Coffee (Companion App) |
|---|---|---|
| Activity capture | Manual entry or unreliable Einstein Activity Capture | Automatic from email, calendar, and calls |
| Data enrichment | Manual or separate tools | Automatic via licensed data partners |
| Pipeline change tracking | Requires reporting snapshots configured manually | Automatic with Pipeline Compare |
| Rep adoption required | High, because manual entry is the default | Low, because the agent does the work |
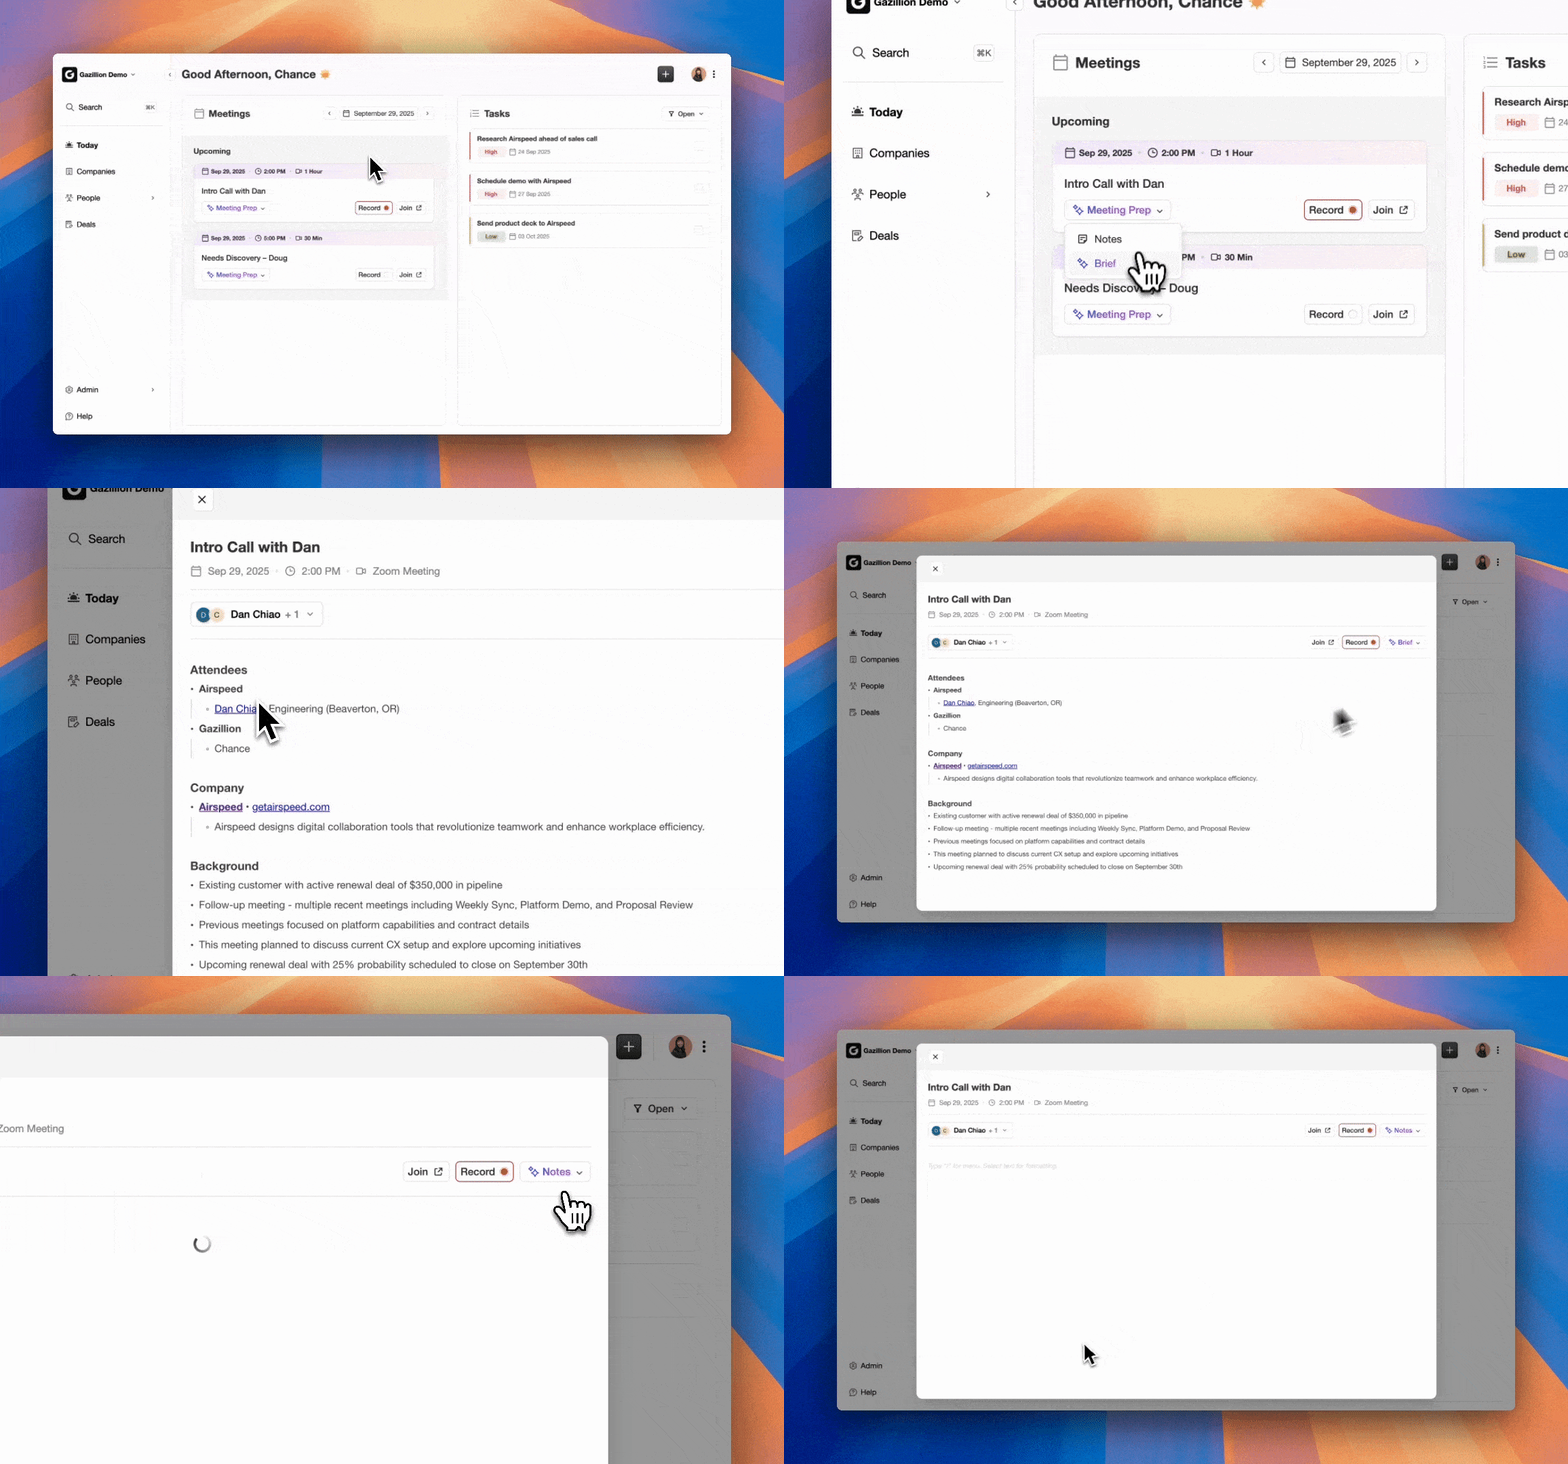
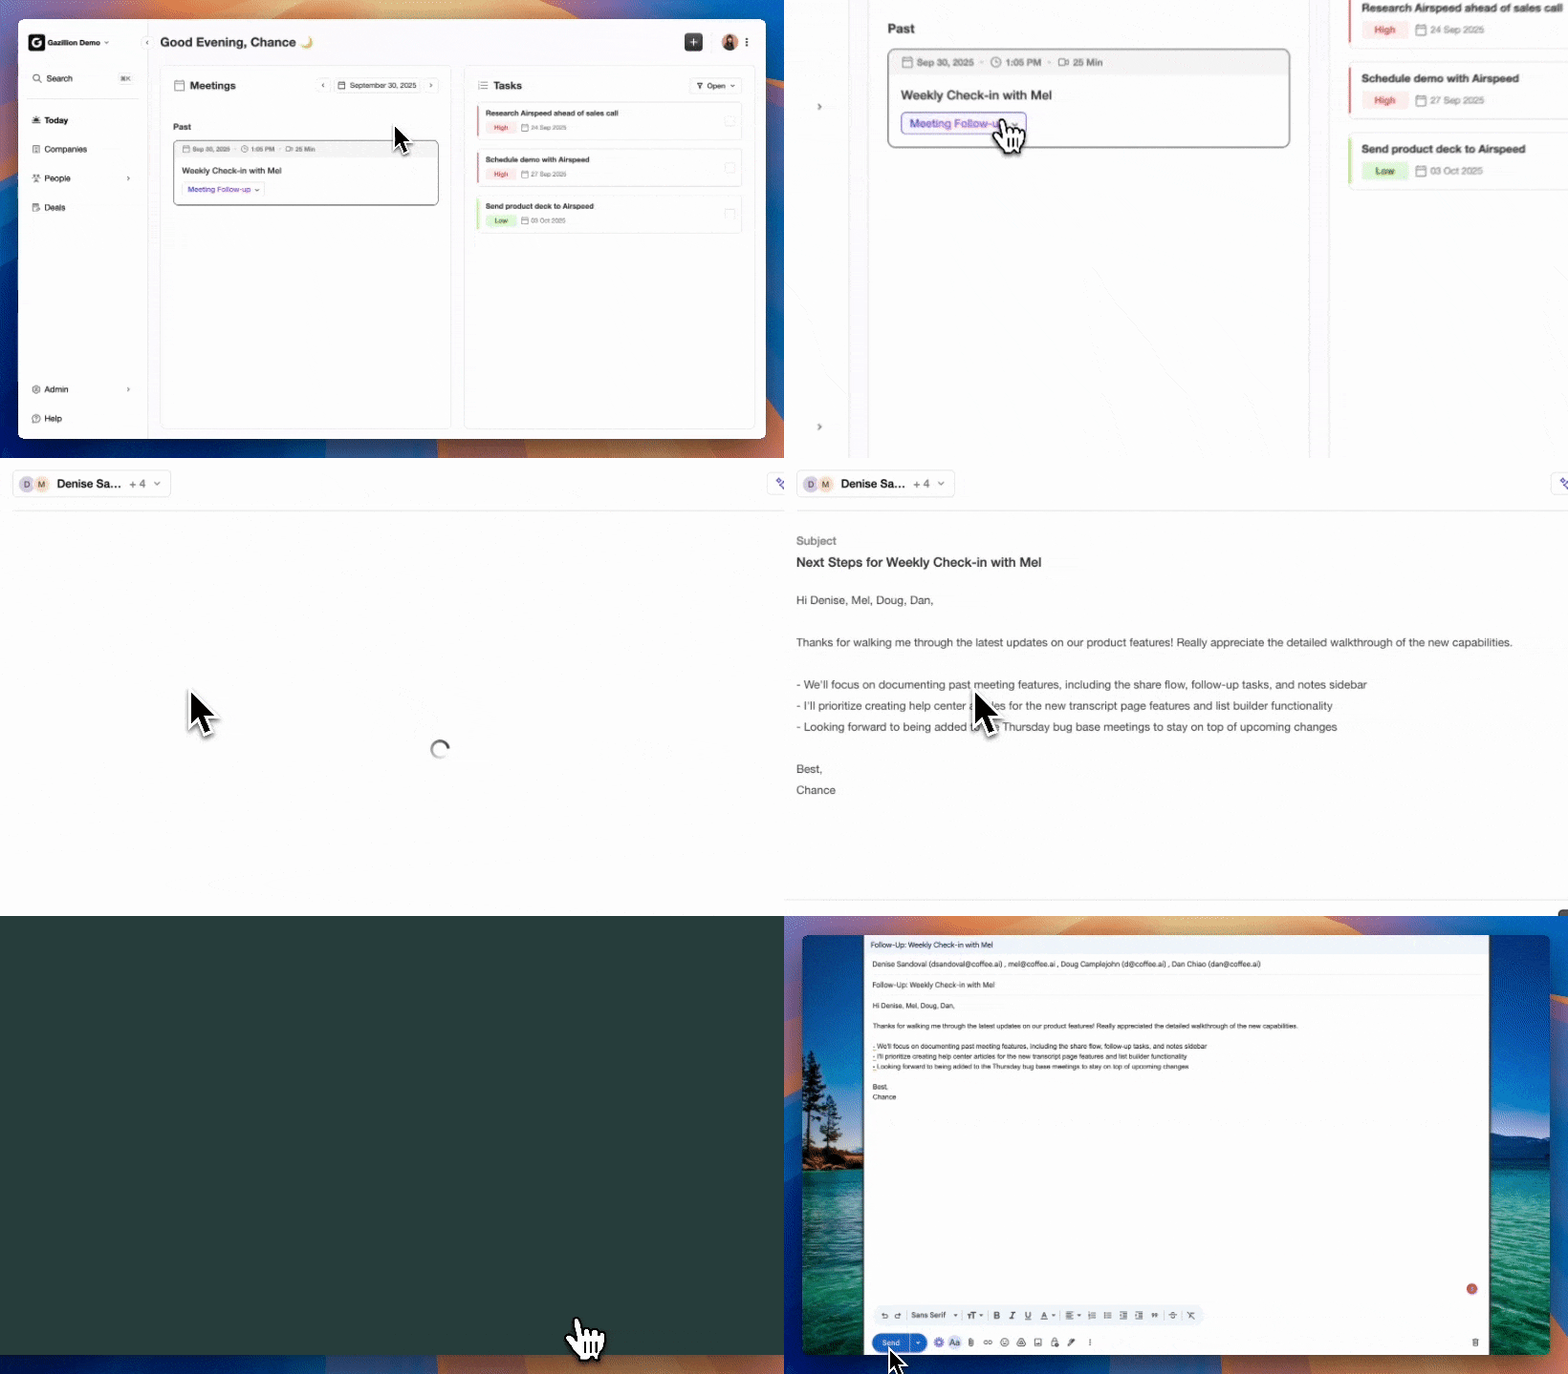
Coffee is an AI agent that automatically logs activities, enriches records, and surfaces pipeline changes. The agent captures emails, calendars, and call transcripts and writes structured data back to Salesforce so monitoring tools always reflect reality. Coffee’s Pipeline Compare feature visualizes week-over-week changes and highlights progressed deals, stalled opportunities, and new additions. This turns pipeline reviews into strategic discussions instead of spreadsheet exercises. Coffee saves reps 8–12 hours per week on data entry, which frees more time for selling and keeps monitoring data current.
See how Coffee automates data capture on the pricing page and remove manual entry as the main cause of unreliable Salesforce monitoring.
Troubleshooting Common Monitoring Issues
Permission issues:
- If users cannot see Pipeline Inspection, first verify the permission set is assigned and the button was added to the Opportunities list view.
- If users see fewer opportunities than expected, the cause is usually access related. Check role hierarchy, sharing rules, territories, and record access.
Stage misalignment:
- If stages do not match the actual sales process, review picklist values and align them to buyer actions instead of seller activities.
- Automation rules may reference old API names after picklist changes. Avoid changing API names once automation depends on them.
Data quality problems:
- If stalled deals go unflagged because Last Activity Date is stale, enforce activity logging or automate capture with a tool like Coffee.
- Duplicate records distort pipeline metrics. Run quarterly data cleanup sprints using Salesforce duplicate management.
Low adoption:
- If reps do not update stages or log activities, use Sales Path to enforce field completion and automate data capture to reduce manual work.
- If managers skip reviews, establish a weekly cadence and hold managers accountable with a defined agenda.
FAQ
How Do I Track Stalled Deals in Salesforce?
Start with a list view or report that filters open opportunities where Last Activity Date is more than 14 days ago and Stage is not Closed. For a more integrated view, use Pipeline Inspection’s stalled opportunity metrics, which surface deals with no recent activity or stage change directly in the review workspace. If you want risk-based prioritization, enable Einstein Opportunity Scoring so it flags deals unlikely to close based on historical patterns. When manual report building is a burden, Coffee surfaces stalled deals automatically by monitoring activity across email, calendar, and calls, so gaps in engagement are flagged without relying on rep-entered data.
What Are the Standard Salesforce Opportunity Stages?
Salesforce ships with nine default stages. Each maps to a forecast category and a default probability percentage:
- Prospecting — 10% probability, Pipeline forecast category
- Qualification — 10%, Pipeline
- Needs Analysis — 20%, Pipeline
- Value Proposition — 50%, Pipeline
- Id. Decision Makers — 60%, Pipeline
- Perception Analysis — 70%, Pipeline
- Proposal/Price Quote — 75%, Best Case
- Negotiation/Review — 90%, Commit
- Closed Won — 100%, Closed
- Closed Lost — 0%, Omitted
Most organizations customize these stages to reflect their actual sales process. Best practice is to align stage names to buyer actions and follow the five-to-seven stage guideline mentioned earlier. Calibrate default probabilities against 12 months of historical closed-won data at least quarterly.
What Are Some Good Monitoring Tools for Salesforce?
Native options include Pipeline Inspection for consolidated pipeline visibility and week-over-week change metrics, Sales Path for enforcing stage discipline and field completion, and custom Reports and Dashboards for scheduled delivery and executive reporting. For teams that want automated data capture and AI-driven insights without manual effort, Coffee acts as a Companion App on top of Salesforce. The Coffee agent automatically logs activities from email, calendar, and calls. It also enriches records via licensed data partners and surfaces pipeline changes through Pipeline Compare. This approach ensures monitoring data reflects reality rather than rep discipline. Coffee also supports natural-language AI search on deals, so users can ask questions like “Which deals are stuck in negotiation?” or “What is closing this month?” and receive immediate answers.
How Do I Set Up Pipeline Inspection?
Go to Setup and search for “Pipeline Inspection” in Quick Find. Open the setup page and enable the feature. Verify that Opportunity historical trending is turned on, because this powers the change metrics that make Pipeline Inspection useful. Add the Pipeline Inspection button to the Opportunities list view page so users can access the workspace. Assign users the appropriate permission set, such as Pipeline Inspection, Pipeline Inspection Included, or Revenue Intelligence, depending on the licenses in your org. Optionally configure Einstein Opportunity Scoring if your org is licensed for it. Allow time after enabling historical trending for data to accumulate before change metrics appear complete.
Why Is My Salesforce Pipeline Data Inaccurate After Configuring Monitoring Tools?
Inaccurate pipeline data almost always traces back to a data-quality problem. Pipeline Inspection, Sales Path, and dashboards act as output tools that display whatever data exists in Salesforce. If reps skip logging activities, updating stages, or maintaining close dates, those tools surface incomplete or misleading information. Common root causes include stale close dates on deals that have slipped multiple times, stage probabilities that were never calibrated against real win rates, missing contact roles on late-stage deals, and activity gaps where emails and calls were never logged. The most durable fix is automating the data-in process so the CRM stays current without relying on rep discipline. Coffee’s Companion App handles this by capturing activity from email, calendar, and call transcripts and writing it back to Salesforce automatically.
Conclusion: Build Your Monitoring Cadence Today
Effective Salesforce deal progression monitoring depends on three elements working together: native tools configured correctly, a consistent weekly review routine, and reliable data feeding the system. Start by configuring Pipeline Inspection for consolidated visibility and week-over-week change tracking. Then set up Sales Path to enforce stage discipline and field completion at the point of entry. Define the KPIs that matter, such as stage duration, win rate, stalled deals, pipeline velocity, and forecast accuracy, and build the reports and dashboards that surface them. Run weekly reviews focused on deals that changed stage, stalled, or have upcoming close dates.
The step many teams skip is fixing the underlying data-quality problem. Despite lacking confidence in their CRM data, 69.9% of sales organizations still rely on CRM reporting as their primary forecasting method. That contradiction produces inaccurate forecasts and surprise losses. Coffee addresses this by automating the data-in process so the agent captures emails, calendars, and call transcripts, enriches records, and writes structured activity data back to Salesforce. This keeps your monitoring aligned with real customer activity.
Ready to automate deal progression monitoring in Salesforce? Start your Coffee trial and automate your monitoring.