Written by: Doug Camplejohn, CEO & Co-Founder, Coffee | Last updated: July 29, 2026
Key Takeaways for Running ABM in 2026
- Account-based marketing (ABM) concentrates resources on a pre-selected list of high-value target accounts instead of broad lead generation, so sales and marketing align around account-level pipeline and revenue.
- ABM depends on firmographic, technographic, and intent data plus buying-committee mapping, all unified automatically in the CRM to avoid the manual-entry bottleneck that undermines most programs.
- Successful ABM programs start with a narrow ICP derived from closed-won data, then build a tiered target account list of 25–50 accounts with coordinated multi-channel campaigns and a formal sales-marketing SLA.
- Measurement shifts from MQL volume to account engagement score, pipeline per dollar, win-rate lift, average deal size, and sales-cycle length, with measurable revenue impact expected in months 3–6.
- Teams ready to automate the data foundation that powers ABM can automate the ABM data layer with Coffee to unify account data and scale personalized outreach without manual entry.
How ABM Differs from Traditional Marketing
Traditional lead generation and ABM diverge in direction, data requirements, and how success is defined. Traditional lead generation starts broad and qualifies down. ABM starts narrow and goes deep.
| Dimension | Traditional Lead Gen | Account-Based Marketing | Source |
|---|---|---|---|
| Targeting | Broad audience, individual contacts | Pre-selected Target Account List (TAL) of named companies | InboundLabs |
| Data requirements | Basic contact fields, form fills | Firmographics, technographics, buying-committee contacts, and intent signals across all tier-1 accounts | Apollo |
| Tech stack implications | CRM, marketing automation, ad platforms | CRM with account-level tracking, intent data, visitor identification, and sequencing, unified in one system | Pepper Effect |
| Measurement | MQLs, CPL, form fills, SQL conversion rate | Account engagement score, pipeline per dollar, win-rate lift, deal size, sales-cycle length | ZenABM |
| Sales-marketing alignment | Sequential handoff: marketing generates, sales qualifies | Joint account list, shared SLAs, and weekly reviews from day one | GTME Agency |
The table above shows how ABM trades contact volume for account depth. This shift in focus explains why ABM-led programs often generate higher pipeline per marketing dollar than broad-reach demand generation.
ABM in Action: A 50-Person SaaS Example
A 50-person B2B SaaS company sells a revenue-intelligence platform with a $60,000 average contract value. The sequence below illustrates how a 2026 ABM motion runs in practice.
The RevOps lead drops a visitor-identification pixel on the pricing page. Within 48 hours, the system surfaces three named contacts at a target financial-services firm, including a VP of Sales, a Director of Revenue Operations, and a CFO, along with the pages they visited and time on site. Those contacts are auto-enrolled into a five-step email sequence that references the firm's recent funding round and links to a case study from a comparable company.
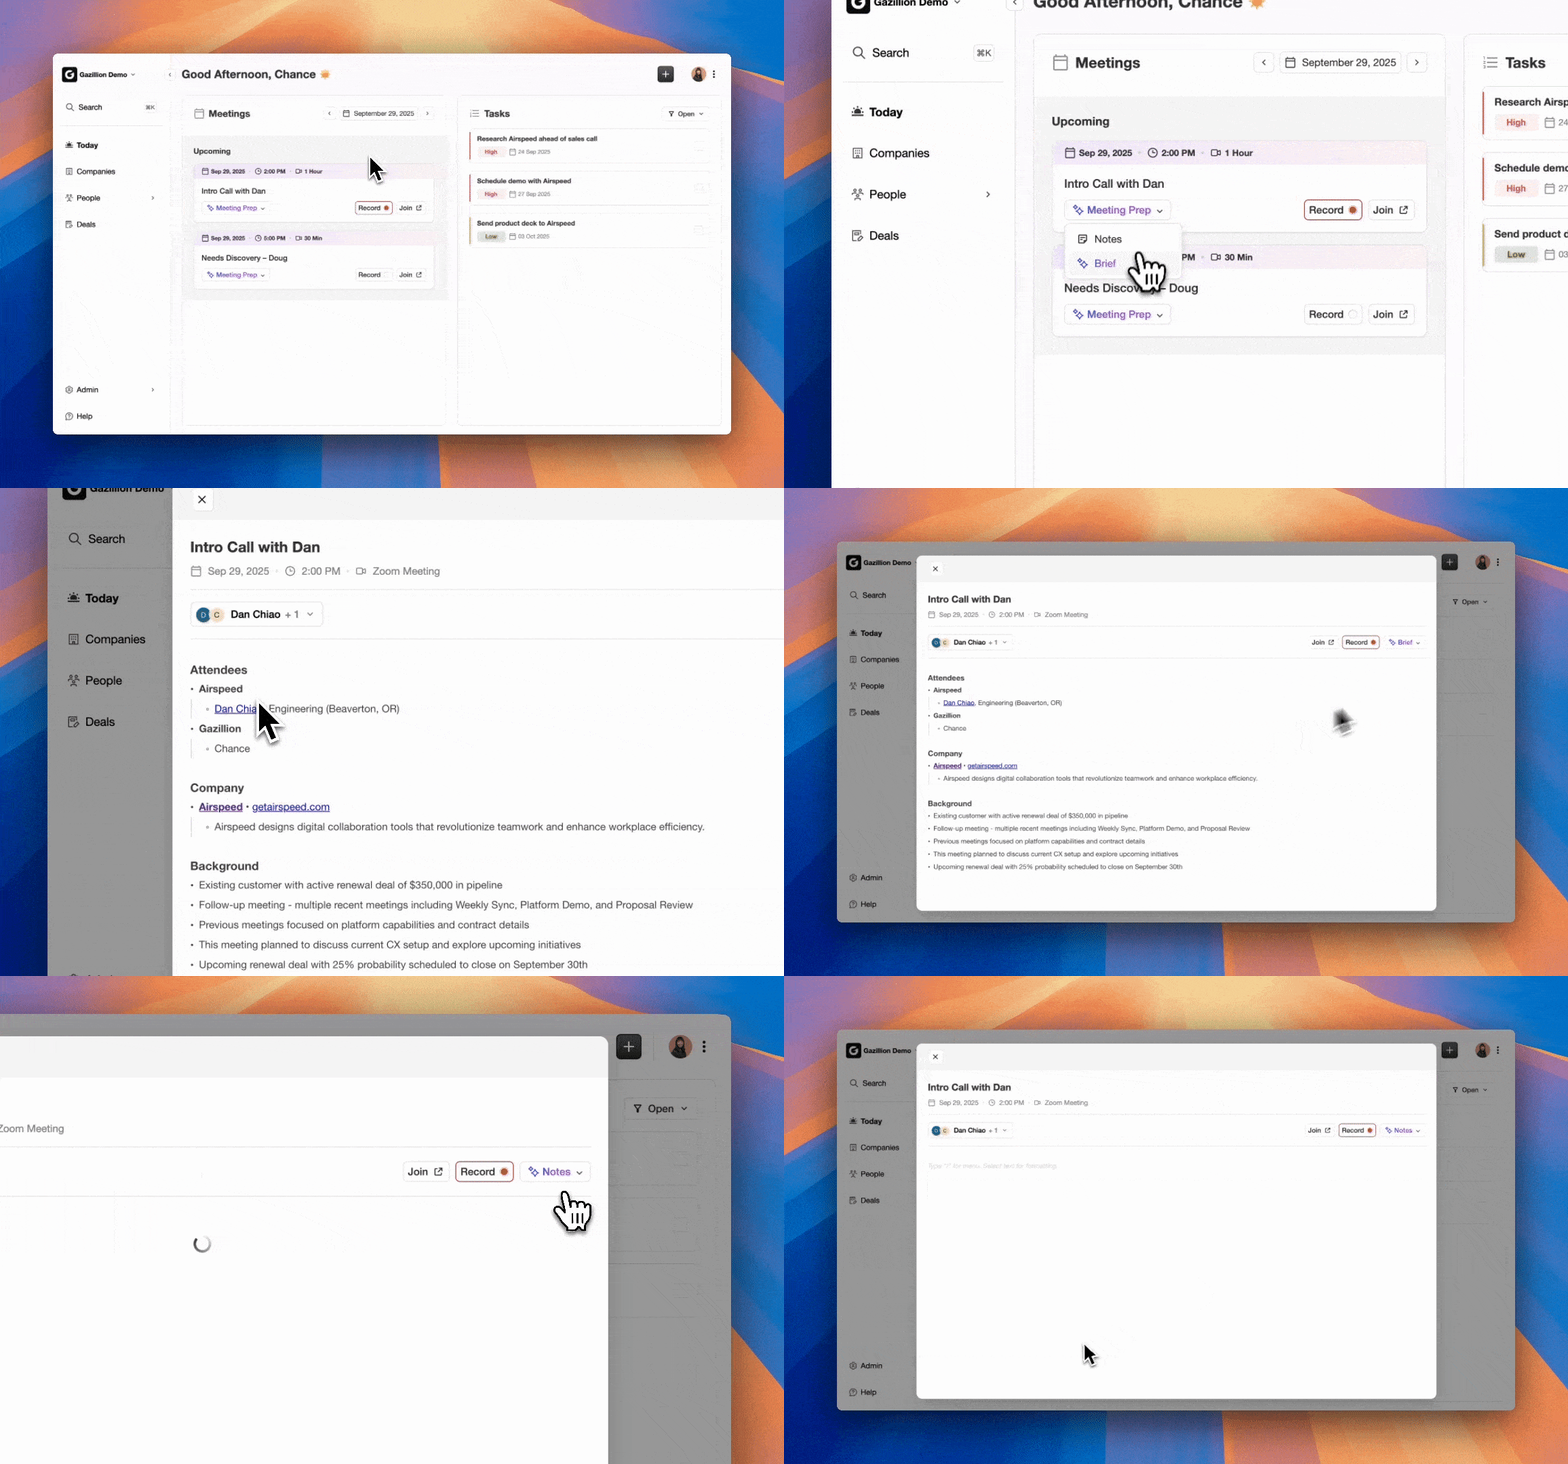
At the same time, LinkedIn retargeting ads serve the same three contacts industry-specific creative. The account engagement score climbs above the threshold, which triggers a Slack alert to the assigned account executive. The AE books a discovery call within 48 hours, matching the SLA agreed with marketing.
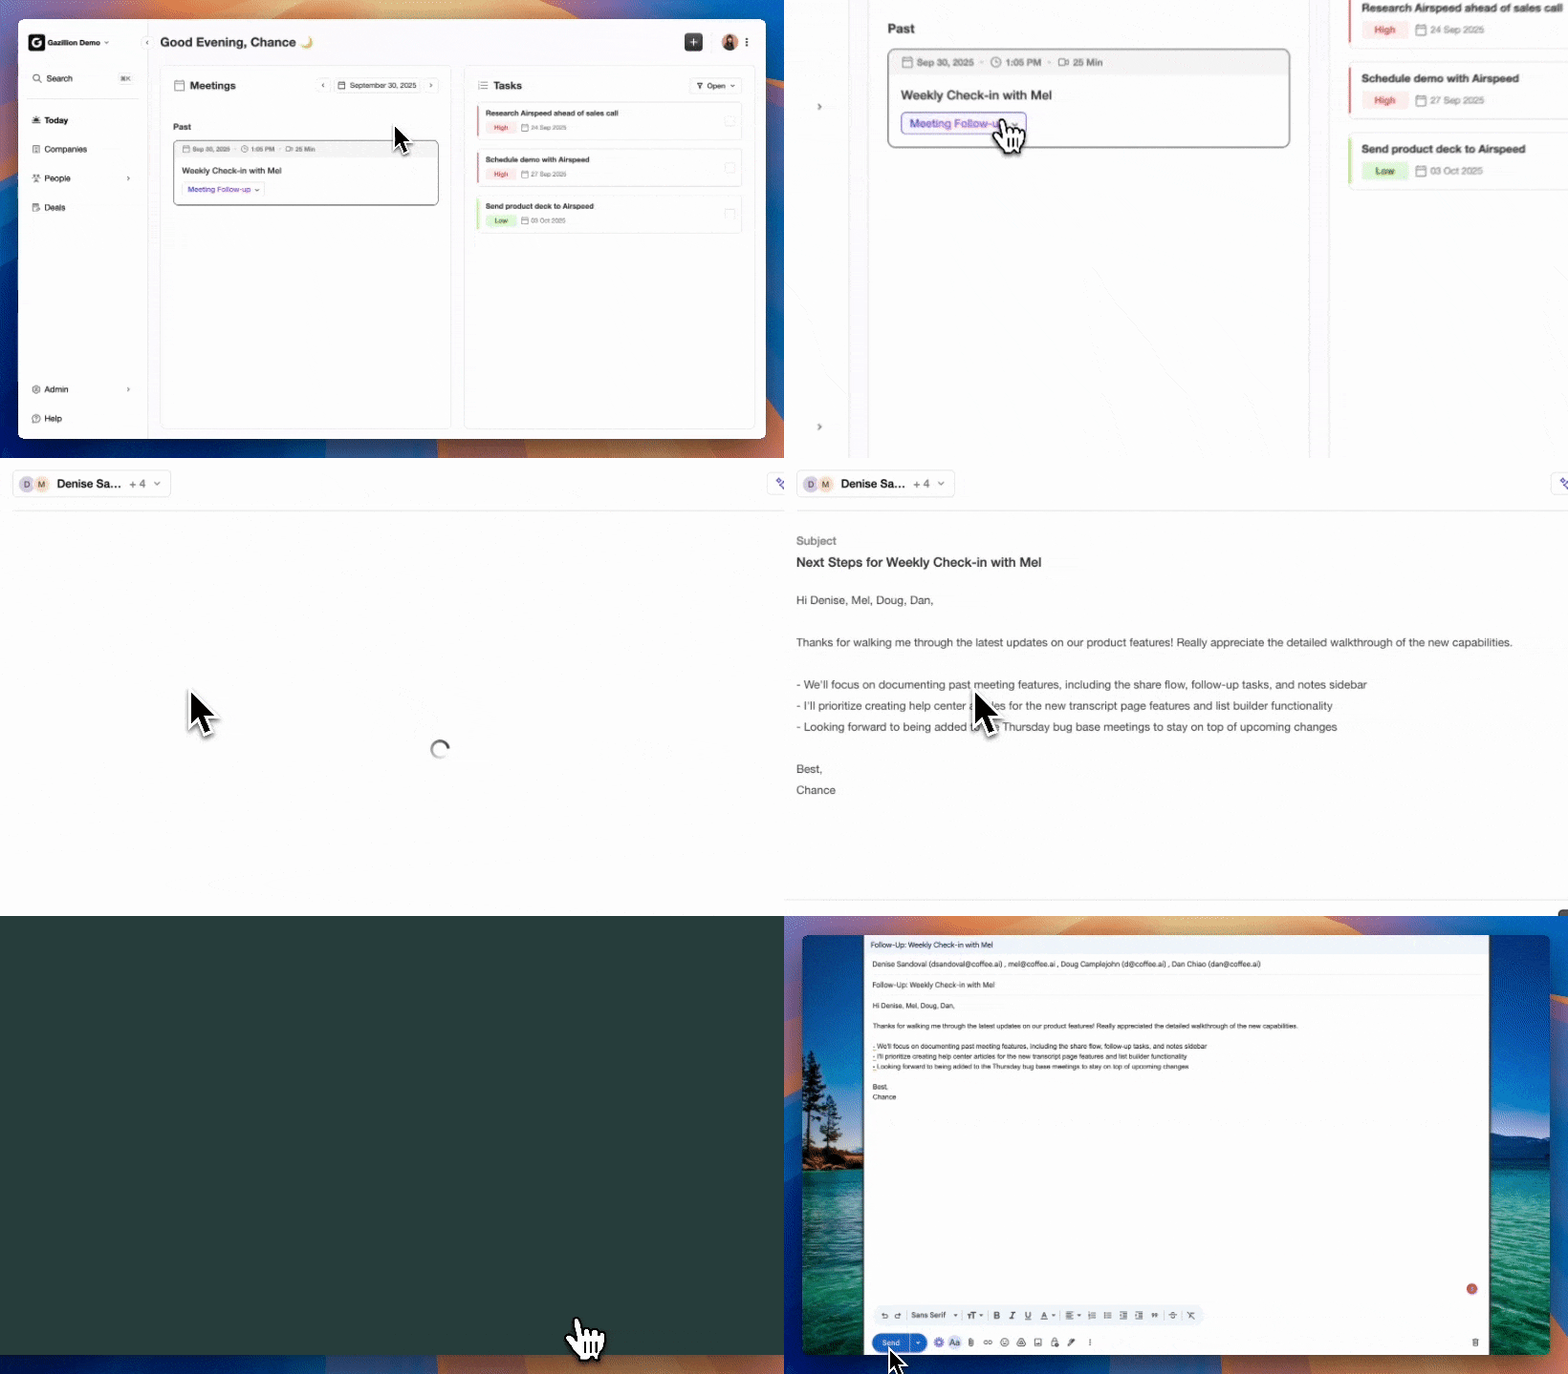
94% of buying groups have ranked their preferred vendors before contacting sales, and the vendor ranked first wins approximately 80% of the time. The coordinated motion above aims to earn that first-rank position before the buying group reaches out.
Automate your ABM data foundation with Coffee and enable the coordinated, real-time outreach described above.
How to Start Account-Based Marketing in 90 Days
The six steps below reflect a realistic 90-day launch for a B2B SaaS team of 20–100 people. Each step builds on the one before it.

- Define the ICP from closed-won data. Analyze 12–24 months of closed-won and closed-lost deals. Identify patterns in industry, company size, tech stack, sales-cycle length, and deal size. Update the ICP quarterly as a living document.
- Build a tiered target account list with sales. Start with 25–50 accounts, which keeps the list small enough for meaningful personalization. Apply 1:1 personalization to the top 5–10 accounts, 1:few clustering for the next 20–40, and standard demand gen for the rest, so resources match revenue potential. Because this list represents a shared commitment of marketing spend and sales capacity, neither team adds or removes accounts unilaterally.
- Unify account data through an agent, not manual entry. This step is the one most teams skip, and it determines whether every subsequent step works. B2B contact data decays at a significant rate each year, and many enterprise accounts have incomplete buying-committee data in CRM systems. An agent that ingests emails, calendar events, call transcripts, and enrichment feeds, then writes clean records back to the CRM automatically, removes the manual-entry bottleneck. Marketers who have unified their customer data are more likely to use AI agents to scale efforts than those who have not.
- Map buying committees for tier-1 accounts. Use the unified data foundation from Step 3 to identify the economic buyer, technical buyer, champion, and end user at each account. B2B buying groups include 14–23 stakeholders in enterprise mega-deals above $1M. Single-threaded outreach fails at that scale.
- Launch coordinated multi-channel campaigns. Sequence paid warm-up before sales outreach. Use account-specific messaging tied to each stakeholder's role. When buying-group members receive consistent ad impressions and aligned sales touches, pipeline conversion can rise above the cold-outreach baseline.
- Establish a sales-marketing SLA and weekly cadence. Marketing commits to delivering engaged accounts and weekly engagement-score updates. Sales commits to first outreach within 48 hours of an account being flagged and logs all activity in the CRM. Only a minority of companies running ABM report tight alignment, yet aligned teams often achieve faster revenue growth and higher ABM ROI.
The data-quality step in Step 3 is the non-negotiable prerequisite. The constraint that does not disappear with any AI layer is data quality, and for most organizations, the data foundation question is where a meaningful share of targeting improvement actually lives. Coffee's agent handles this automatically by ingesting structured data such as CRM fields and enrichment and unstructured data such as emails, call transcripts, and calendar events, then writing accurate records back without human intervention.
Core ABM Tools for 2026
A functional ABM stack in 2026 covers four categories that work together to support targeting, outreach, and measurement.
- Agentic CRM platforms. These systems of record auto-capture contacts, log activity, enrich records, and surface pipeline intelligence, without requiring manual entry from reps.
- Visitor identification pixels. These tools convert anonymous website traffic into named prospects with firmographic context, which enables real-time outreach to accounts already showing interest.
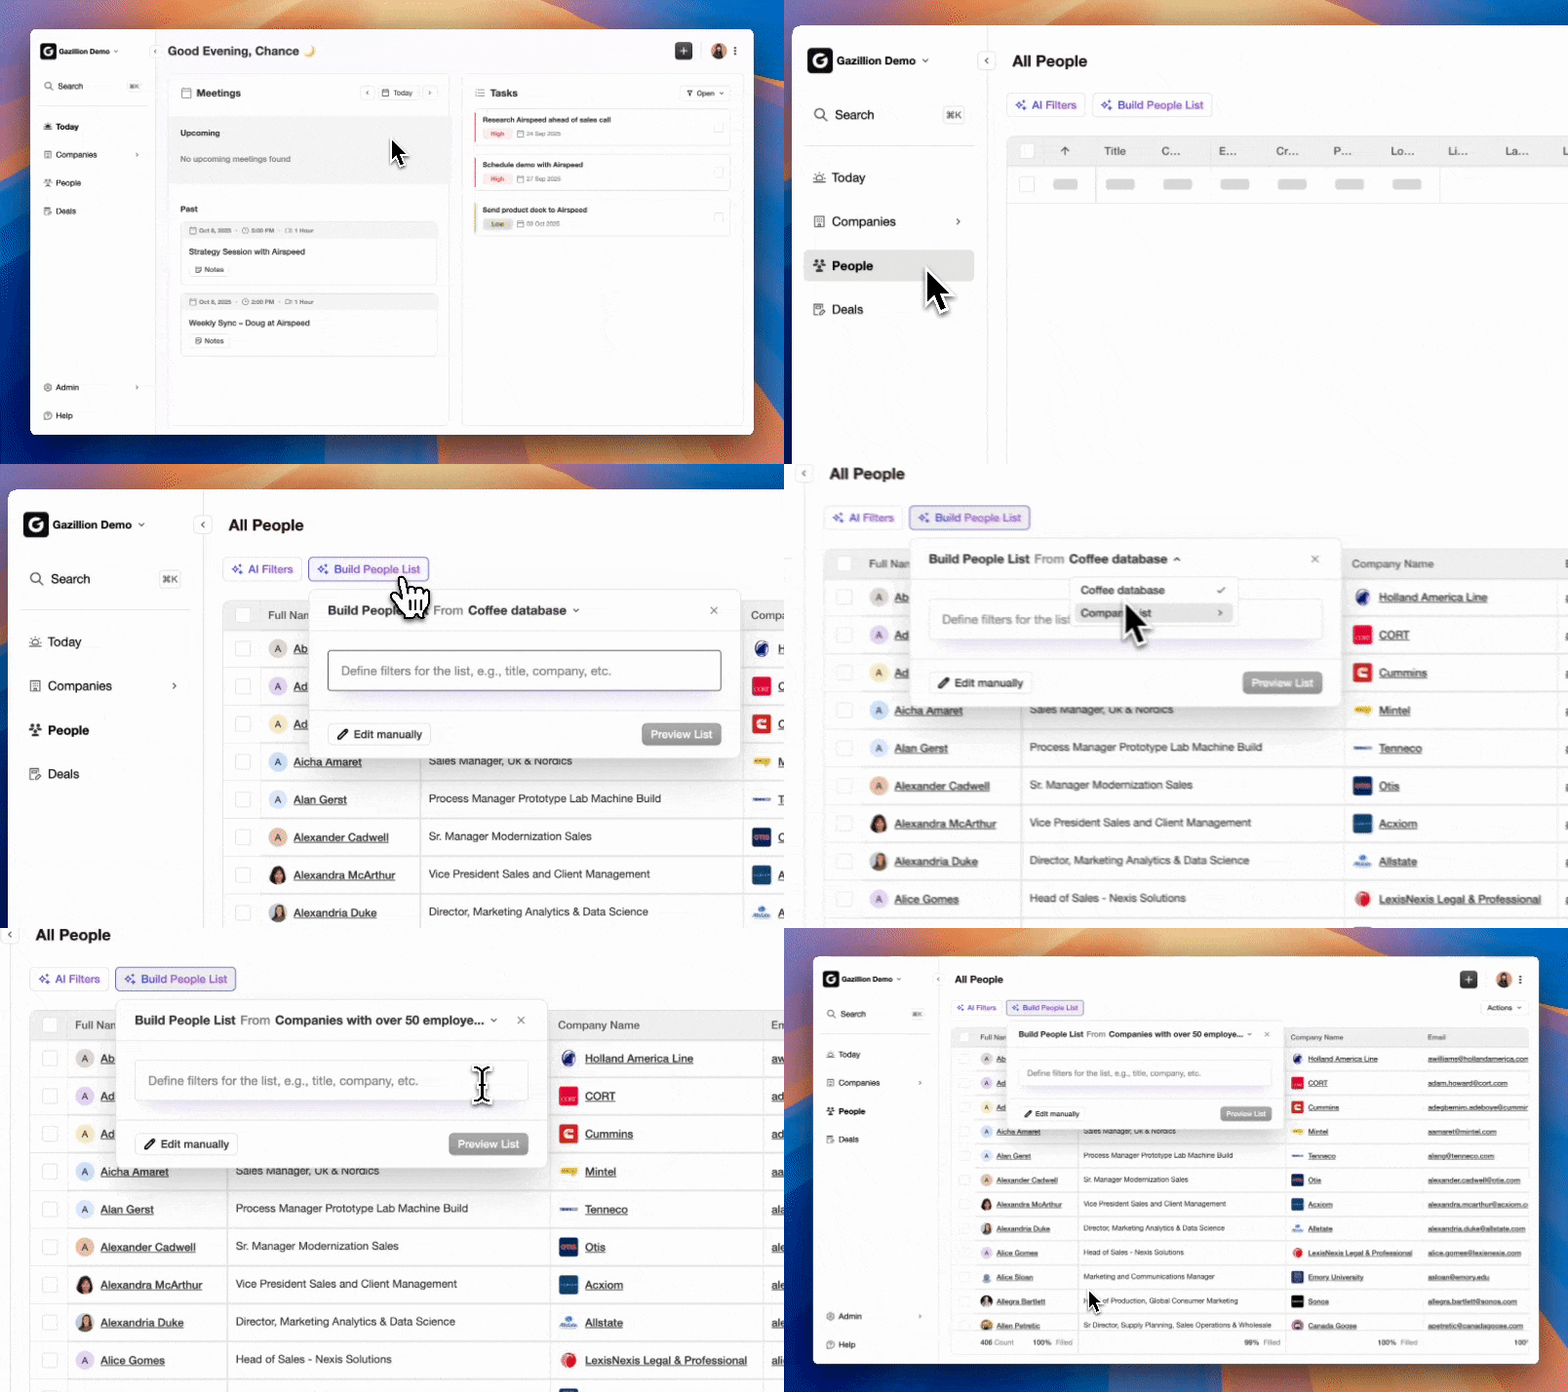
- Natural-language lead finders. These interfaces allow teams to query a prospect database in plain English, such as “VPs of Sales at SaaS companies with 50–200 employees,” and generate enriched lists ready for outreach.
- Native sequencing. These tools run multi-step email campaigns from the rep's own mailbox, stop on reply, and feed engagement data back into the CRM account record automatically.
The biggest ABM mistake mid-market companies make is buying technology before defining the ICP, content strategy, and orchestration process. Choose tools after the process is defined, not before.
Consolidate your ABM stack with Coffee, one agent that covers all four tool categories above.
When ABM Makes Sense for Your Team
ABM fits best when several conditions are true at the same time.
- Average contract value exceeds $25,000–$50,000. Below $25,000 ACV, account-level personalization costs typically exceed per-deal returns.
- Sales cycles run three months or longer.
- Buying committees involve three or more stakeholders.
- The addressable market is finite, typically 500–5,000 companies that fit the ICP.
- The CRM is maintained by an agent, not by reps doing manual entry, because fragmented, stale data makes every downstream ABM step unreliable.
For B2B SaaS teams of 20–100 employees, ABM is particularly well-suited. When full 1:1 personalization is not feasible across the entire target list, many mid-sized enterprises adopt Account-Based Marketing Lite, which uses one-to-few strategies that group similar accounts by industry or behavior. Limited budgets go further when concentrated on a short, well-researched account list.
Common ABM Pitfalls to Avoid
- Fragmented data sources. Many marketers lack complete access to sales and commerce data, which means targeting decisions rely on incomplete records and produce misdirected campaigns.
- Reliance on manual entry. As noted in the adoption criteria, reliance on manual entry creates the data-quality gap that causes many ABM programs to underperform. The agent-based capture described in Step 3 removes this failure mode.
- No sales-marketing SLA. Many B2B teams struggle to align sales and marketing on ABM execution. Without defined handoff criteria and shared dashboards, campaigns generate engagement that sales never acts on.
- Too many accounts. Programs anchored on 1,000 accounts collapse into lightly targeted lead generation because teams cannot deliver per-account personalization at that scale.
- Measuring with the wrong metrics. MQL volume is a lead-gen metric, so ABM programs measured on MQLs will optimize for the wrong behavior.
How to Measure Account-Based Marketing Success
ABM measurement tracks account-level commercial outcomes, not contact-level activity. The checklist below covers the metrics that matter at each stage.
| Metric | What it measures | Target benchmark |
|---|---|---|
| Account engagement score | Composite of email opens, site visits, content downloads, and ad clicks weighted by recency | Meaningful engagement among target accounts in initial months |
| Pipeline per dollar spent | Pipeline value generated from ABM accounts divided by ABM spend | Strong pipeline returns per dollar spent for mature ABM programs |
| Win-rate lift | Win rate on ABM target accounts vs. non-target accounts | Median ABM win rates are 38% for 1:1 programs, 24% for 1:few, and 14% for 1:many, all above the 9% non-ABM baseline |
| Average deal size | ACV of closed ABM accounts vs. non-ABM accounts | Higher average deal sizes for ABM accounts compared to non-ABM accounts |
| Sales-cycle length | Days from first engagement to closed-won for ABM accounts | Shorter sales cycles for ABM accounts compared to broad-reach programs |
Teams typically see awareness signals in weeks 1–4, first meetings from tier-1 accounts in months 2–3, and measurable pipeline impact in months 3–6. B2B sales cycles for complex deals can take up to 18 months, so leaders need that timeline before the program launches.
Accurate measurement depends on the same prerequisite as accurate targeting, which is clean account data written automatically to the CRM after every interaction. Without an agent handling that logging, pipeline-influence reports reflect only the activity reps remembered to record.
Build the data foundation your ABM program requires with Coffee's automated activity logging.
Frequently Asked Questions
What is the difference between ABM and traditional lead generation?
Traditional lead generation optimizes for volume. It casts a wide net, generates large numbers of individual contacts, and hands them to sales for qualification. ABM inverts this. Marketing and sales agree on a short list of named accounts before any campaign runs. Every dollar, message, and sales touch is directed at those accounts and their buying committees. The unit of measure shifts from individual leads to account-level pipeline and revenue. The two approaches are not mutually exclusive, because many B2B teams run lead generation for lower-ACV products and ABM for their highest-value segments simultaneously.
How many accounts should a small B2B SaaS team target with ABM?
For a team of 20–100 employees running ABM for the first time, 25–50 accounts is a practical starting range. As outlined in the implementation steps, the top 5–10 accounts receive fully personalized 1:1 outreach, and the next 20–40 receive segment-level personalization grouped by industry or use case. The remainder can be served with programmatic tactics. Starting with more than 50 accounts typically causes personalization to collapse into generic outreach, which defeats the purpose of ABM. Teams should demonstrate results at this scale before expanding the list.
Why is data quality so critical for ABM, and how does automation help?
ABM requires accurate firmographic data, current contact titles, buying-committee coverage, and timely intent signals for every account on the target list. Given the significant annual decay in contact data mentioned earlier, manual entry cannot keep pace with the rate of change. When reps are responsible for keeping records current, they rarely do, because manual entry competes with selling time. The automated capture and enrichment process outlined earlier removes this dependency entirely, so targeting, personalization, and measurement all operate from accurate data rather than from whatever a rep last typed into a field.
How long does it take to see results from an ABM program?
A realistic timeline for a mid-market B2B SaaS company shows awareness and engagement signals in weeks 1–4, first meetings booked from tier-1 accounts in months 2–3, measurable pipeline impact in months 3–6, and win-rate and deal-size improvements visible by months 6–9. Revenue impact typically appears in months 9–12. Programs abandoned before month four rarely generate enough data to evaluate fairly. Setting these expectations with leadership before launch prevents premature cancellation.
What metrics should replace MQLs when measuring ABM success?
The four metrics that reflect ABM's commercial impact are account engagement score, pipeline contribution from target accounts, win-rate lift compared to non-ABM accounts, and average deal size for ABM-sourced opportunities. Sales-cycle length against a pre-ABM baseline is a fifth useful indicator. These metrics require account-level data in the CRM, with every email, call, and meeting logged against the correct account record. Teams that still measure ABM programs on MQL volume will optimize for the wrong behavior and underreport the program's true impact.