Written by: Doug Camplejohn, CEO & Co-Founder, Coffee | Last updated: July 28, 2026
Key Takeaways for Mid-Market ABM Teams
- Account-based marketing (ABM) delivers 2.6x more pipeline per marketing dollar than broad-reach demand generation, which makes it a strong fit for mid-market B2B SaaS teams with limited resources.
- Effective ABM execution follows an 8-step, 90-day process that fixes poor CRM data quality, misaligned sales-marketing goals, and heavy manual data-entry work.
- Core steps include defining a tiered ICP, building a verified target account list, aligning on shared SLAs, mapping buying committees, and designing personalized multi-channel plays.
- Automation plays a central role. Coffee’s agent-led CRM removes the 5.5 hours per week reps spend on manual data entry by auto-capturing, enriching, and logging every account interaction.
- Teams ready to remove the data-entry grind and scale their ABM program can see Coffee’s pricing and start a trial today.
ABM Readiness Checklist for Mid-Market Teams
Confirm these prerequisites before you invest time in the 90-day ABM rollout.
- Executive sponsor (CEO or CRO) committed to cross-functional authority
- CRM access with at least 18 months of closed-won deal history
- A working ICP hypothesis based on existing customer patterns
- At least one dedicated owner each from sales and marketing
- Agreement that MQL volume will not be the primary success metric
Of these prerequisites, executive sponsorship is the most commonly underestimated. Without a CEO or CRO who can resolve cross-functional conflicts, ABM programs stall when sales and marketing disagree on account prioritization, so resolve this before you proceed.
Step 1: Define and Tier Your ICP
Inputs: 18 months of closed-won data. Owner: RevOps with sales leadership. Output: A written, falsifiable ICP statement and tier definitions.
A useful ICP includes firmographics, technographics, and trigger conditions so a rep can determine fit within 30 seconds. Weight the ICP by revenue, not deal count. If 70% of revenue comes from a handful of accounts, the ICP should reflect that profile. The following table shows how to structure your account tiers based on engagement intensity and investment level.
| Tier | Account Count | Engagement Model | Annual Investment per Account |
|---|---|---|---|
| Tier 1 — Strategic | 10–30 accounts | 1:1 bespoke programs | $5,000–$25,000 |
| Tier 2 — Growth | 50–150 accounts | 1:few segment plays | $500–$2,000 |
| Tier 3 — Opportunity | 500–2,000 accounts | 1:many automated | $25–$150 |
Step 2: Build and Enrich the Target Account List
Inputs: ICP definition, firmographic and technographic data sources. Owner: Marketing ops. Output: A verified target account list (TAL) with buying-committee contacts.
A target account list should be sized carefully so you avoid wasting enrichment budget. Score accounts using the formula Fit × (Intent + Engagement), with scores ≥60 becoming Tier 1, 30–59 Tier 2, and below 30 remaining in nurture. Once you have scored and tiered your accounts, follow this 90-day timeline to move from initial list construction into active pursuit.

| Phase | Days | Key Actions | Owner |
|---|---|---|---|
| Foundation | 1–15 | Mine win data, build TAL v1, verify contacts | RevOps |
| Activation | 16–30 | Assign tiers, draft plays, wire tech stack | Marketing + Sales |
| Execution | 31–60 | Run Tier 3 plays, weekly reviews | Marketing |
| Pursuit | 61–90 | Launch Tier 1 pursuits, lock graduation rules | AEs + Marketing |
Failure mode: Lists built manually go stale, and data quality assumed rather than verified is a leading cause of TAL failure. Coffee’s agent automatically creates and enriches contacts and companies from emails and calendars, which removes this risk without manual effort. Try Coffee’s automated TAL enrichment from day one.
Step 3: Align Sales and Marketing on Shared Goals and SLAs
Inputs: TAL, tier definitions, historical baseline metrics. Owner: Head of Sales and Head of Marketing jointly. Output: A signed SLA document with shared account-level KPIs.
Companies with formal sales-marketing alignment tend to achieve higher ABM goal attainment than those without that structure. The SLA must specify response times, account ownership, and the definition of a meaningful engagement event. Use these three core metrics as your baseline SLA targets for the first 90 days.
| Metric | Target (Days 1–90) | Owner |
|---|---|---|
| Target account coverage | 80%+ of TAL engaged within 60 days | Marketing |
| Multi-stakeholder engagement | 40%+ of accounts show multi-stakeholder engagement within 90 days | Sales + Marketing |
| Account-to-opportunity rate | 15–25% of engaged accounts progress to opportunity within a quarter | Sales |
Failure mode: If sales does not validate and commit to the account list, the program is likely to fail before launch.
Step 4: Map Buying Committees
Inputs: TAL, enrichment data. Owner: AEs with marketing support. Output: A documented buying committee map per Tier 1 account, with roles and contact details.
A complex B2B purchase now moves through a buying group of six to ten decision makers. For each Tier 1 account, map the economic buyer, primary decision maker, technical evaluator, internal champion, and procurement contact. Single-threading to one contact is a documented cause of stalled deals.
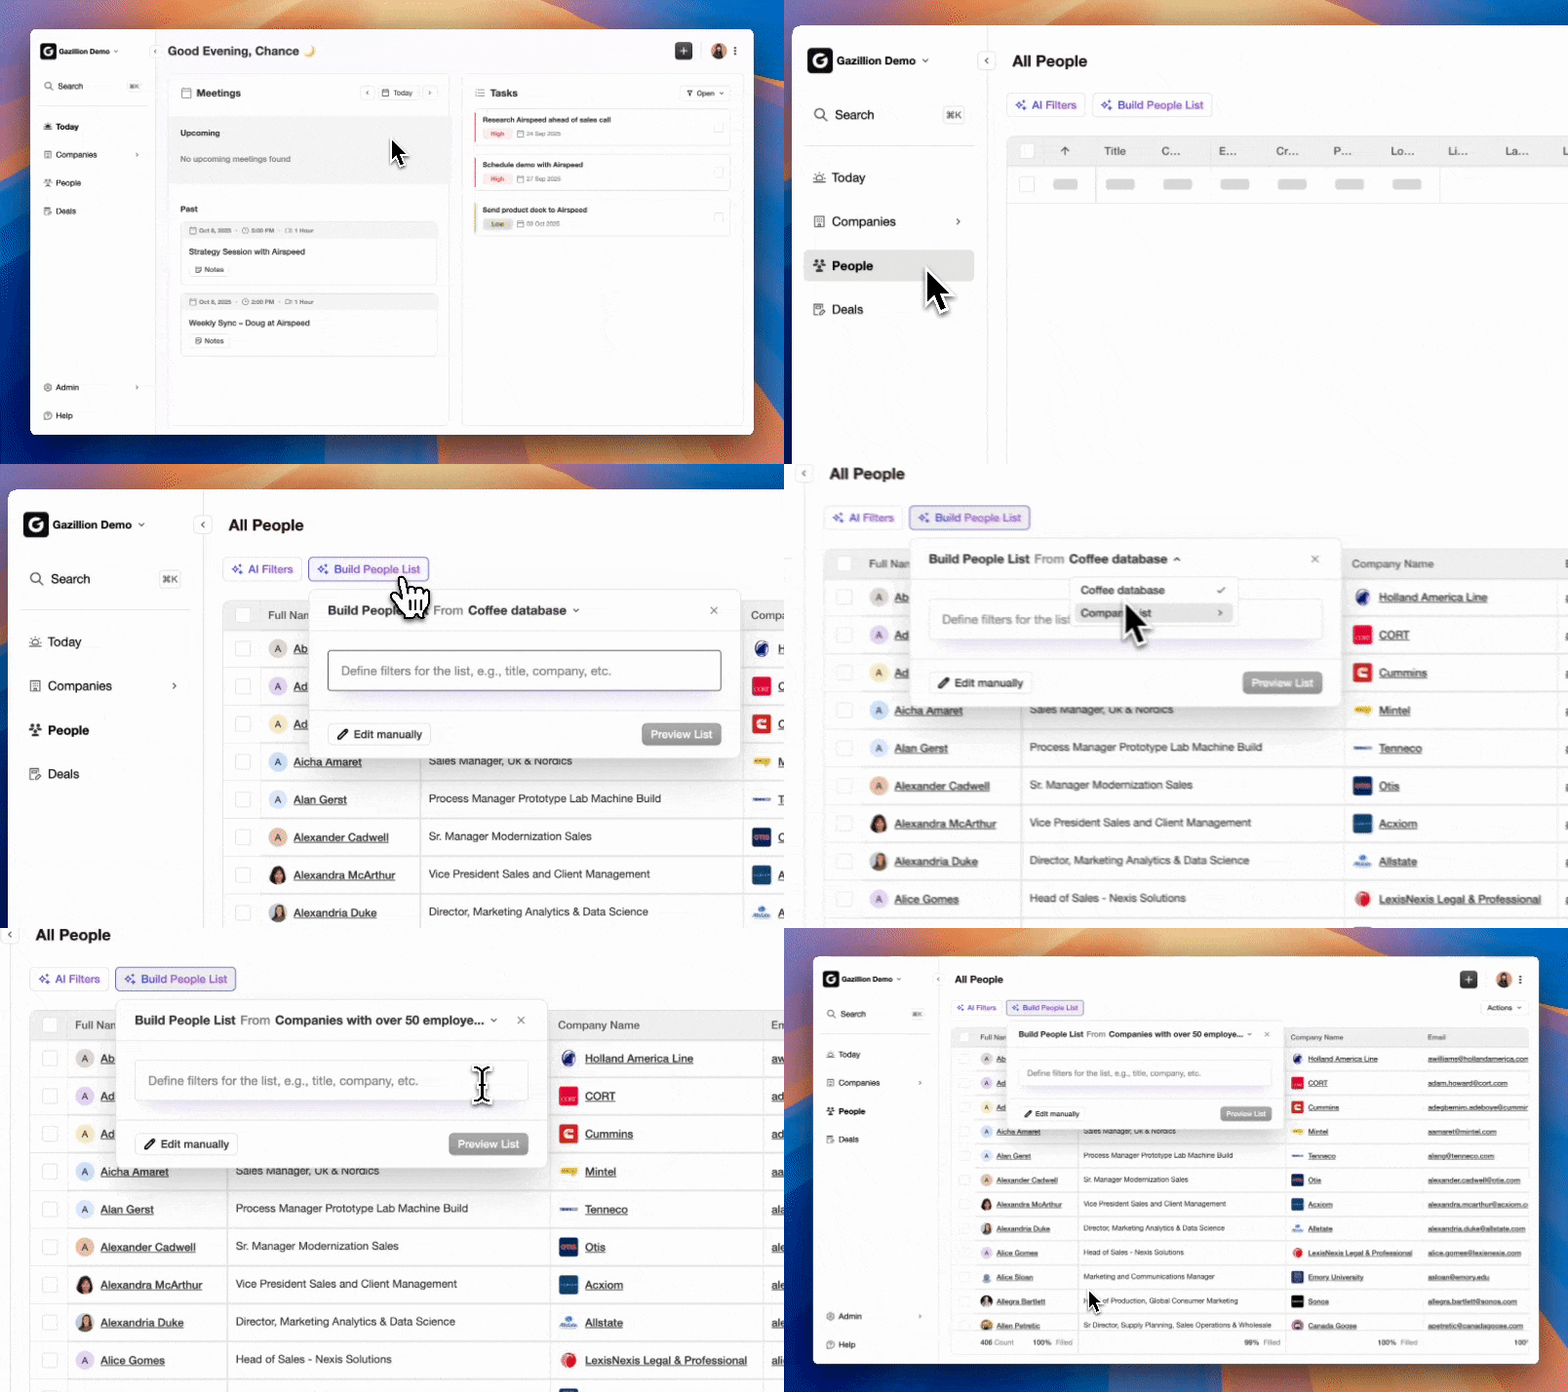
To avoid this risk, target three to five unique contacts per account for mid-market deals. The same automation that enriches your TAL, described in Step 2, also surfaces buying-committee members from email and calendar data and connects every interaction to the correct account record without manual logging.
Step 5: Design Personalized Multi-Channel Plays
Inputs: Buying committee maps, tier definitions, channel inventory. Owner: Marketing with AE input. Output: One documented play per tier with trigger, sequence, and exit condition.
B2B buyers now engage suppliers across ten or more channels, up from five in 2016. A play combines a trigger, a sequence, and an exit condition. An example Tier 2 play: a funding announcement triggers a 12-day multi-channel sequence of LinkedIn ads, a relevance email, an AE voice note, and a vertical one-pager, exiting on no engagement rather than a fixed cadence length.
Tier 1 plays rely on bespoke research and executive-to-executive outreach. Tier 3 plays run primarily through automation.
Step 6: Operationalize Data Capture and Enrichment
Inputs: CRM, email and calendar connections, enrichment sources. Owner: RevOps. Output: Automated data flows that log every account interaction without manual entry.
Manual CRM data entry costs sales teams significant time, including the 5.5 hours per week mentioned earlier. This step is where ABM programs most commonly degrade. Reps skip logging, enrichment goes stale, and the TAL becomes a liability.
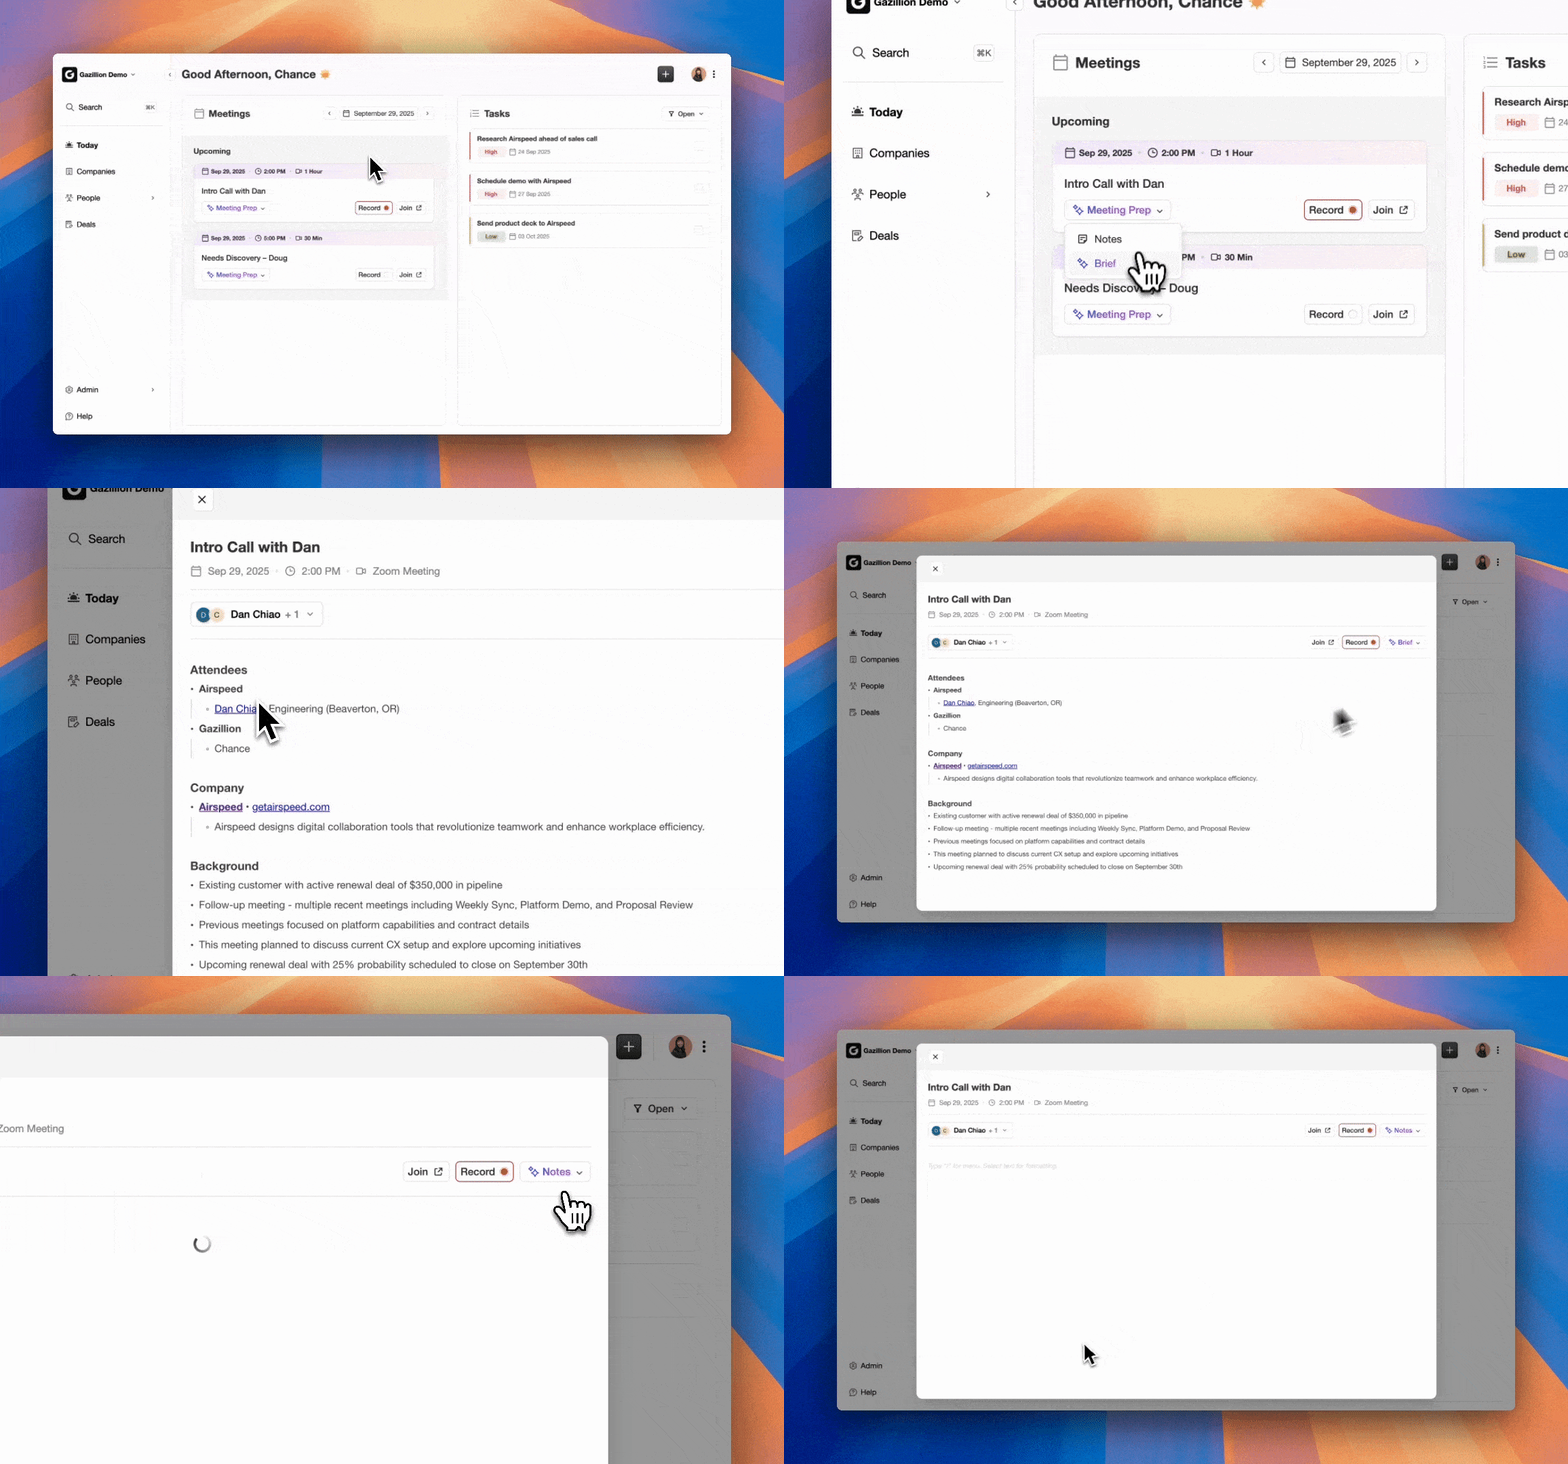
Automation eliminates this failure point. Coffee’s agent connects to Google Workspace or Microsoft 365 and immediately begins auto-creating contacts, logging activities, and enriching records with job titles, funding data, and LinkedIn profiles. As a Companion App for existing Salesforce or HubSpot instances, Coffee writes enriched data back to the primary CRM without disrupting current workflows. AI-powered CRM integrations can improve accuracy in data capture. See how Coffee eliminates data entry and stops ABM programs from stalling.
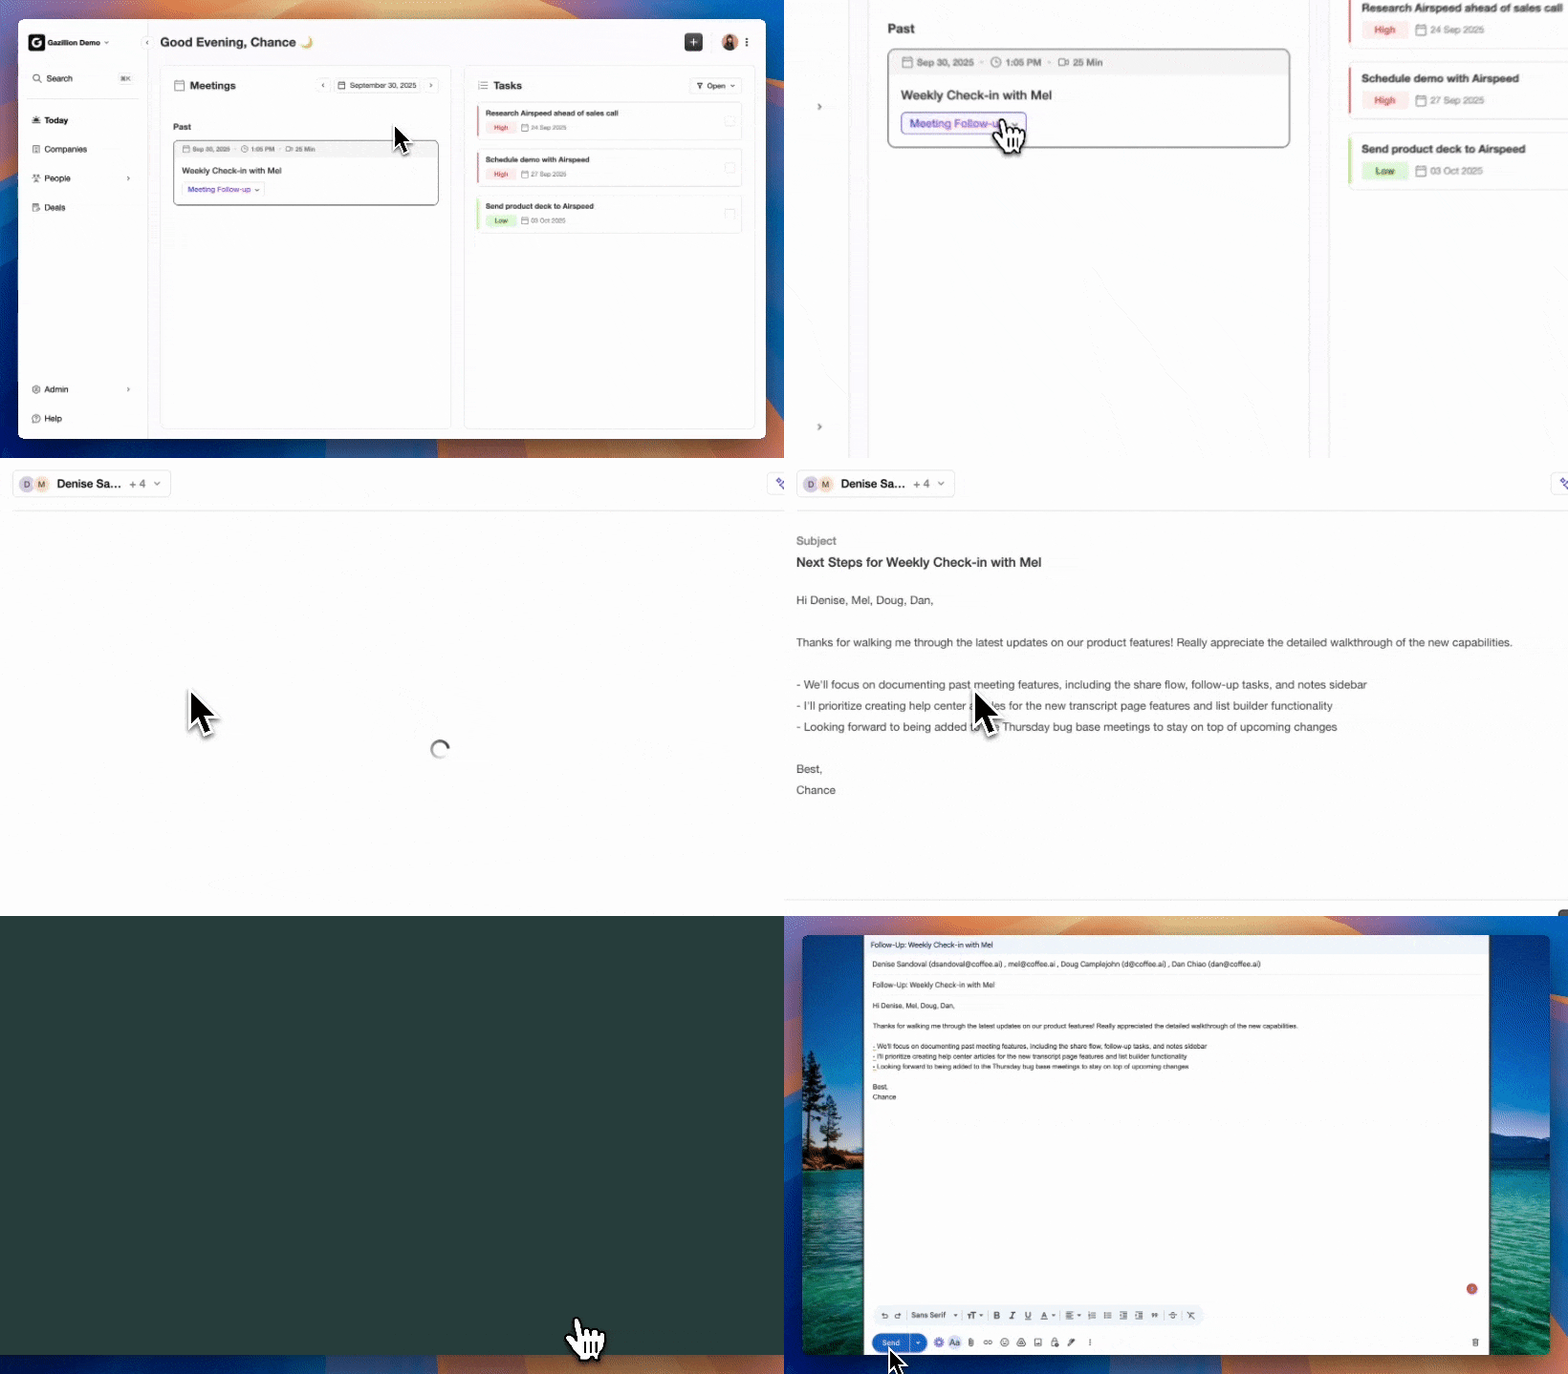
Step 7: Launch and Monitor Account-Level Metrics
Inputs: Live plays, instrumented CRM, shared dashboards. Owner: Marketing ops and RevOps. Output: Weekly coverage and engagement reports, plus monthly pipeline reports.
Only 29% of ABM teams measure success with ABM-aligned metrics, while the rest continue to report on MQLs. Replace MQL reporting with a tiered cadence that moves from leading to lagging indicators.
- Weekly: Track real-time engagement signals, including account engagement scores, engagement velocity, and target account website traffic, to see which accounts are warming up.
- Monthly: Measure coverage and multi-stakeholder breadth, including account coverage, multi-stakeholder engagement rate, and pipeline generated from TAL, to confirm that plays reach the full buying committee.
- Quarterly: Evaluate business outcomes, including pipeline velocity, win rates by tier, deal size, and program ROI, to determine whether the program delivers on its revenue goals.
Mature ABM programs often see strong target account engagement within the first 90 days. If engagement stays low, revisit audience definition and channel mix.
Step 8: Optimize with a 90-Day Review Cadence
Inputs: 90-day metric report, tier performance by cohort. Owner: Head of Sales and Head of Marketing. Output: Updated TAL, revised tier assignments, documented graduation rules.
As noted in Step 1, account tiers are not static. They should be re-reviewed quarterly as accounts move through different engagement levels. At the 90-day review, evaluate the following items.
- Which accounts progressed to opportunity stage
- Which plays produced the highest account-to-opportunity conversion
- Where multi-stakeholder engagement fell below the 40% benchmark
- Whether CRM data quality held without manual intervention
Tier graduation should be triggered only after the prior tier demonstrates real meeting-to-pipeline conversion, not by calendar date alone.
Validation: How to Confirm Your ABM Engine Is Healthy
At the 90-day mark, a healthy ABM program shows consistent signals across data quality, adoption, coverage, and pipeline velocity.
- Lead-to-account match rate above 95% in the CRM
- 80%+ of the TAL showing at least one engagement touchpoint, which aligns with the earlier SLA coverage target
- Zero accounts with blank enrichment fields such as job title, company size, or tech stack
- Sales reps referencing CRM data in account reviews rather than spreadsheets, which signals adoption
- ABM-sourced deals closing 15–30% faster than non-ABM pipeline
- Median ABM win rates reaching 38% for 1:1 programs versus a 9% non-ABM B2B baseline
Scaling Guidance for Growing Your Target Account List
Scaling from 20–50 accounts to 200+ accounts uses the same data-quality foundation, applied at higher volume. Enterprise teams can typically support only 5 to 15 accounts at the 1:1 tier before engagement quality degrades, while mid-market teams support 20–75. Expansion beyond that threshold requires adding AE capacity or shifting accounts to Tier 2 plays.
The practical scaling sequence follows a validate-then-automate-then-expand pattern.
- Prove Tier 1 conversion before expanding the Tier 1 list, because you need evidence that high-touch engagement converts before you commit more resources.
- Automate Tier 3 enrichment and sequencing fully before adding accounts, since manual processes that work at 50 accounts will break at 200.
- Once automation is stable, use Coffee’s List Builder to generate new TAL segments via natural language commands as ICP assumptions are validated.
- Layer in Coffee’s Visitor Identification pixel to surface anonymous website traffic from target accounts and route high-fit visitors directly into active sequences, which expands reach without expanding the list.
- Re-run the 90-day review cadence for each new account cohort added to ensure quality does not degrade as volume increases.
Scale your TAL with Coffee’s automation without adding headcount.
Frequently Asked Questions
How long does it realistically take to see pipeline results from an ABM program?
Account coverage and engagement metrics typically show positive signals within 30 to 60 days of launch. Pipeline metrics require 90 to 180 days to materialize, depending on sales cycle length. For mid-market B2B SaaS deals in the $15K–$100K (or $25K–$250K) ACV range, sales cycles typically fall in the 30–120 day range, with medians near 60–105 days and an overall B2B SaaS median around 84 days. Revenue-level outcomes such as win-rate lift and ACV improvement generally take 12 to 18 months to fully materialize. The 90-day playbook is designed to validate leading indicators such as coverage, engagement, and account-to-opportunity rate before the program has enough pipeline history to report on lagging metrics.
Who should own the ABM program at a 50-person B2B SaaS company?
Ownership is shared, but accountability must be singular. The most effective structure assigns a RevOps lead as the program operator responsible for data quality, measurement, and TAL maintenance. The Head of Sales owns account-level pursuit, and the Head of Marketing owns play design and channel execution. A CEO or CRO should serve as executive sponsor with authority to resolve cross-functional conflicts. Programs where ownership defaults entirely to marketing tend to lose sales commitment to the account list within the first 60 days, which is the most common early failure mode.
What tools are required to run ABM without an enterprise budget?
A functional mid-market ABM stack does not require six-figure platforms. The minimum viable stack includes a CRM with account-level reporting, an enrichment layer for contact and firmographic data, a sequencing tool for multi-channel outreach, and a measurement dashboard. Coffee replaces several of these components by acting as an agent that auto-creates contacts, enriches records, logs all activity from email and calendar, and surfaces pipeline intelligence, either as a standalone CRM or as a Companion App layered on top of an existing Salesforce or HubSpot instance. For teams already committed to Salesforce or HubSpot, Coffee’s Companion App writes enriched data back to the primary system without requiring a platform migration.
How do you prevent the target account list from going stale?
A static TAL becomes a liability over time. Accounts change through acquisitions, leadership turnover, headcount shifts, and new buying signals. The recommended maintenance cadence uses a quarterly ICP and tier review combined with continuous monitoring of trigger signals such as funding events, hiring changes, and tech-stack shifts. Coffee’s agent handles the continuous layer automatically by scanning emails and calendars to update contact records and activity logs in real time, which keeps the CRM aligned with current account state without manual audits. The quarterly review then focuses on strategic decisions such as tier movements, ICP refinements, and play adjustments rather than data cleanup.
What is the right size for a starting target account list?
For a $10M–$40M ARR mid-market B2B SaaS company, the recommended starting configuration is 10 to 20 Tier 1 strategic accounts receiving 1:1 engagement, plus 100 to 150 Tier 2 accounts receiving segment-level plays. The total TAL should be sized to avoid wasting enrichment budget and creating poor prioritization downstream. Programs that anchor on 1,000 accounts at launch consistently revert to generic demand-gen behavior because the personalization required for true ABM cannot be sustained at that volume with mid-market resources.
Conclusion: Build ABM on Accurate, Automated Data
Implementing account-based marketing at mid-market scale functions as an 8-step operating process, not a one-off campaign. The sequence of ICP definition, TAL construction, sales-marketing alignment, buying committee mapping, play design, data operationalization, metric monitoring, and 90-day optimization should run as a feedback loop anchored in accurate account data. Many organizations report improving pipeline growth from ABM, and that outcome depends on the data quality and alignment discipline built into the first 30 days.
The manual data-entry grind is the most preventable failure point in this process. Coffee’s agent removes it by automatically capturing, enriching, and logging every account interaction, whether deployed as a standalone CRM or as a Companion App on top of Salesforce or HubSpot. Teams that remove the data-entry burden in Step 6 run faster reviews, maintain cleaner TALs, and spend their limited capacity on the strategic work that actually moves accounts through the pipeline. Build your ABM program on Coffee’s automated data foundation from day one.