Written by: Doug Camplejohn, CEO & Co-Founder, Coffee | Last updated: August 13, 2026
Key Takeaways
- Firmographic data such as industry, headcount, revenue, geography, and funding stage acts as the structural filter for your outbound universe before you add any signals.
- Building a reliable outbound account universe follows six repeatable steps: define ICP from closed-won data, map attributes to filterable fields, suppress non-fits, layer intent and technographic signals, score and tier accounts, and activate dynamic lists with clear KPIs.
- Combining firmographic filters with intent and technographic signals enables precise prioritization. Tier 1 accounts with three or more signals receive personal outreach within 24–48 hours, while lower tiers move into longer nurture cadences.
- Common data-hygiene pitfalls include relying on company size alone, using stale enrichment cadences, and skipping suppression lists. Quarterly or real-time refresh cycles keep pipeline quality high.
- Turn firmographic filters into prioritized outbound lists with Coffee, all without leaving your CRM.
Six Practical Steps to Build Your Outbound Account Universe
- Define your ICP in closed-won data. Pull the last 12–18 months of closed-won deals. Extract the firmographic attributes such as industry, headcount band, revenue range, geography, and funding stage that appear most often among your best customers. Confirm that ICP-fit accounts close at roughly twice the rate of non-ICP accounts before you lock the definition.
- Map firmographic attributes to filterable fields. Translate ICP attributes into standardized, machine-readable values. Use NAICS codes instead of free-text industry labels, fixed headcount bands such as 1–50, 51–200, and 201–500, and revenue ranges instead of point estimates. Inconsistent values such as “SaaS” versus “Software” versus “Technology” break segmentation and routing logic in outbound systems.
- Build and suppress your account universe. Apply positive ICP filters to generate the eligible account pool. This creates your maximum addressable universe based on structural fit. Next, run a suppression pass to remove accounts you should never contact, including existing customers, churned accounts, companies below the minimum employee threshold, excluded industries, and accounts flagged “not a fit” in CRM disposition codes before any sequence launches.
- Layer intent and technographic signals. Firmographic filters define who could buy. Signals highlight who is ready now. Apply third-party intent topics, hiring velocity, funding announcements, and technographic stack changes on top of the firmographic baseline to surface the accounts worth activating this week.
- Score and tier accounts. Assign composite scores that weight intent signals at 40%, first-party CRM engagement at 35%, and firmographic or technographic fit at 25%. Classify accounts as Tier 1 with three or more signals and personal outreach within 24–48 hours, Tier 2 with two signals and a personalized campaign within one week, or Tier 3 with one signal and low-frequency nurture.
- Activate dynamic lists and measure. Enroll scored accounts into dynamic outreach lists that automatically add new qualifying contacts as the campaign runs. Track intent-to-meeting rate, pipeline share from scored accounts, and score-to-close velocity as primary KPIs instead of raw list size.
Firmographic ICP Examples for Outbound Targeting
The tables below show four ICP configurations expressed in filterable firmographic attributes. Each example aligns with closed-won deal patterns recommended by RP Tech Media's April 2026 guide on firmographic and technographic data.
| ICP Segment | Industry (NAICS) | Headcount | Revenue Range |
|---|---|---|---|
| Sales Intelligence SaaS | B2B SaaS / IT Services / Professional Services | 100–1,000 | $10M–$100M ARR |
| Marketing Automation SaaS | SaaS / eCommerce / Media / Financial Services | 50–500 | $5M–$50M ARR |
| Data Infrastructure SaaS | SaaS / Fintech / Healthcare Tech / Logistics | 200–2,000 | $20M–$200M ARR |
| SMB CRM Replacement | B2B SaaS / Professional Services | 1–200 | $1M–$20M ARR |
| ICP Segment | Geography | Growth Stage | Ownership Structure |
|---|---|---|---|
| Sales Intelligence SaaS | North America / UK / DACH / ANZ | Series B–D | VC-backed or recently public |
| Marketing Automation SaaS | North America / Western Europe | Series A–C | VC-backed or bootstrapped |
| Data Infrastructure SaaS | North America / Europe / Singapore | Series C+ or profitable scaleup | VC-backed or PE-owned |
| SMB CRM Replacement | United States | Seed–Series B | Bootstrapped or VC-backed |
The following schema covers the 30–50 firmographic and intent fields recommended for a complete outbound account record. Refresh cadences follow Apollo's recommended minimum re-verification cadences for outbound datasets.
| Field Category | Example Fields | Data Type | Refresh Cadence |
|---|---|---|---|
| Identity | Company name, domain, HQ address, phone | String | Quarterly |
| Size | Global headcount band, local headcount, department count | Integer / Band | Monthly |
| Industry | NAICS code, SIC code, internal vertical tag | Enum | Annually or on change |
| Revenue | ARR range, estimated revenue, revenue growth rate | Range | Semi-annually |
| Geography | HQ country, HQ state, operating regions | Enum | Quarterly |
| Ownership | Public / private, VC-backed, PE-owned, bootstrapped, subsidiary flag | Enum | On funding event |
| Funding | Last funding round, funding stage, total raised, lead investor | String / Date | Within days of news signal |
| Growth Signals | Headcount growth rate (12 mo.), hiring velocity, open roles by department | Percentage / Integer | Monthly |
| Technographic | CRM in use, marketing automation, data warehouse, BI tool, security stack | String list | Monthly–quarterly |
| Intent | Third-party topic research score, first-party page visits, content downloads | Score / Boolean | Daily–weekly |
| Engagement | Last CRM activity date, email opens, reply history, meeting count | Date / Integer | Real-time |
| Suppression | Existing customer flag, churned flag, DNC flag, CRM disposition code | Boolean / Enum | Real-time |
How Firmographics, Intent, and Technographics Work Together
Firmographic data changes slowly, typically quarterly to annually, while intent data changes daily to weekly and technographic data refreshes monthly to quarterly. That difference in update speed explains why static firmographic lists have given way to continuously refreshed prioritization models.
The most effective B2B teams use firmographic data to define fit, technographic data to confirm compatibility, and intent data to identify timing. First-mover vendors who contact accounts promptly after a buying signal often see higher conversion rates than those who wait. Technographic data sharpens this timing advantage by combining stack-change signals, such as a company migrating from Salesforce to HubSpot, with intent signals like active research in your category so you reach them while they evaluate replacements, not months later.
A practical signal-stacking prioritization table:
| Tier | Signal Count | Example Triggers | Activation SLA |
|---|---|---|---|
| Tier 1 | 3+ signals | Pricing-page visit + funding round + CRM hire posted | Personal outreach within 24–48 hours |
| Tier 2 | 2 signals | Intent topic spike + leadership change | Personalized campaign within 1 week |
| Tier 3 | 1 signal | Single intent topic research event | Low-frequency educational nurture |
Defining ICP with Firmographic Data
A strong ICP must be specific enough to be exclusive and expressed in data attributes that can filter a target list. Primary dimensions include industry, headcount range, revenue range, geography, and company type. Secondary signals such as headcount growth rate, funding stage, technology stack, and company age refine the primary layer.
Negative ICP attributes such as industries, size bands, or geographies that reliably produce poor outcomes prevent wasted outbound effort. Companies with a clearly defined and operationalized ICP framework see win rates 68% higher than those relying on loosely defined targeting criteria. Teams should revisit ICPs quarterly as the product evolves and new closed-won data accumulates.
Firmographic vs. Technographic Data in Prospecting
Firmographic data describes what a company looks like structurally, including its industry, size, revenue, geography, and ownership. Technographic data describes what a company runs operationally, including its installed software, IT spend, and contract timing. The most complete account intelligence combines technographic data, which confirms fit, with intent data, which confirms timing.
Job descriptions act as a high-value technographic signal. Companies actively hiring for expertise in tools like Snowflake indicate current adoption and buying activity rather than outdated static install records. Neither data type replaces the other. Firmographics gate the universe, and technographics plus intent signals rank it.
Coffee Lead Finder and Campaigns in Action
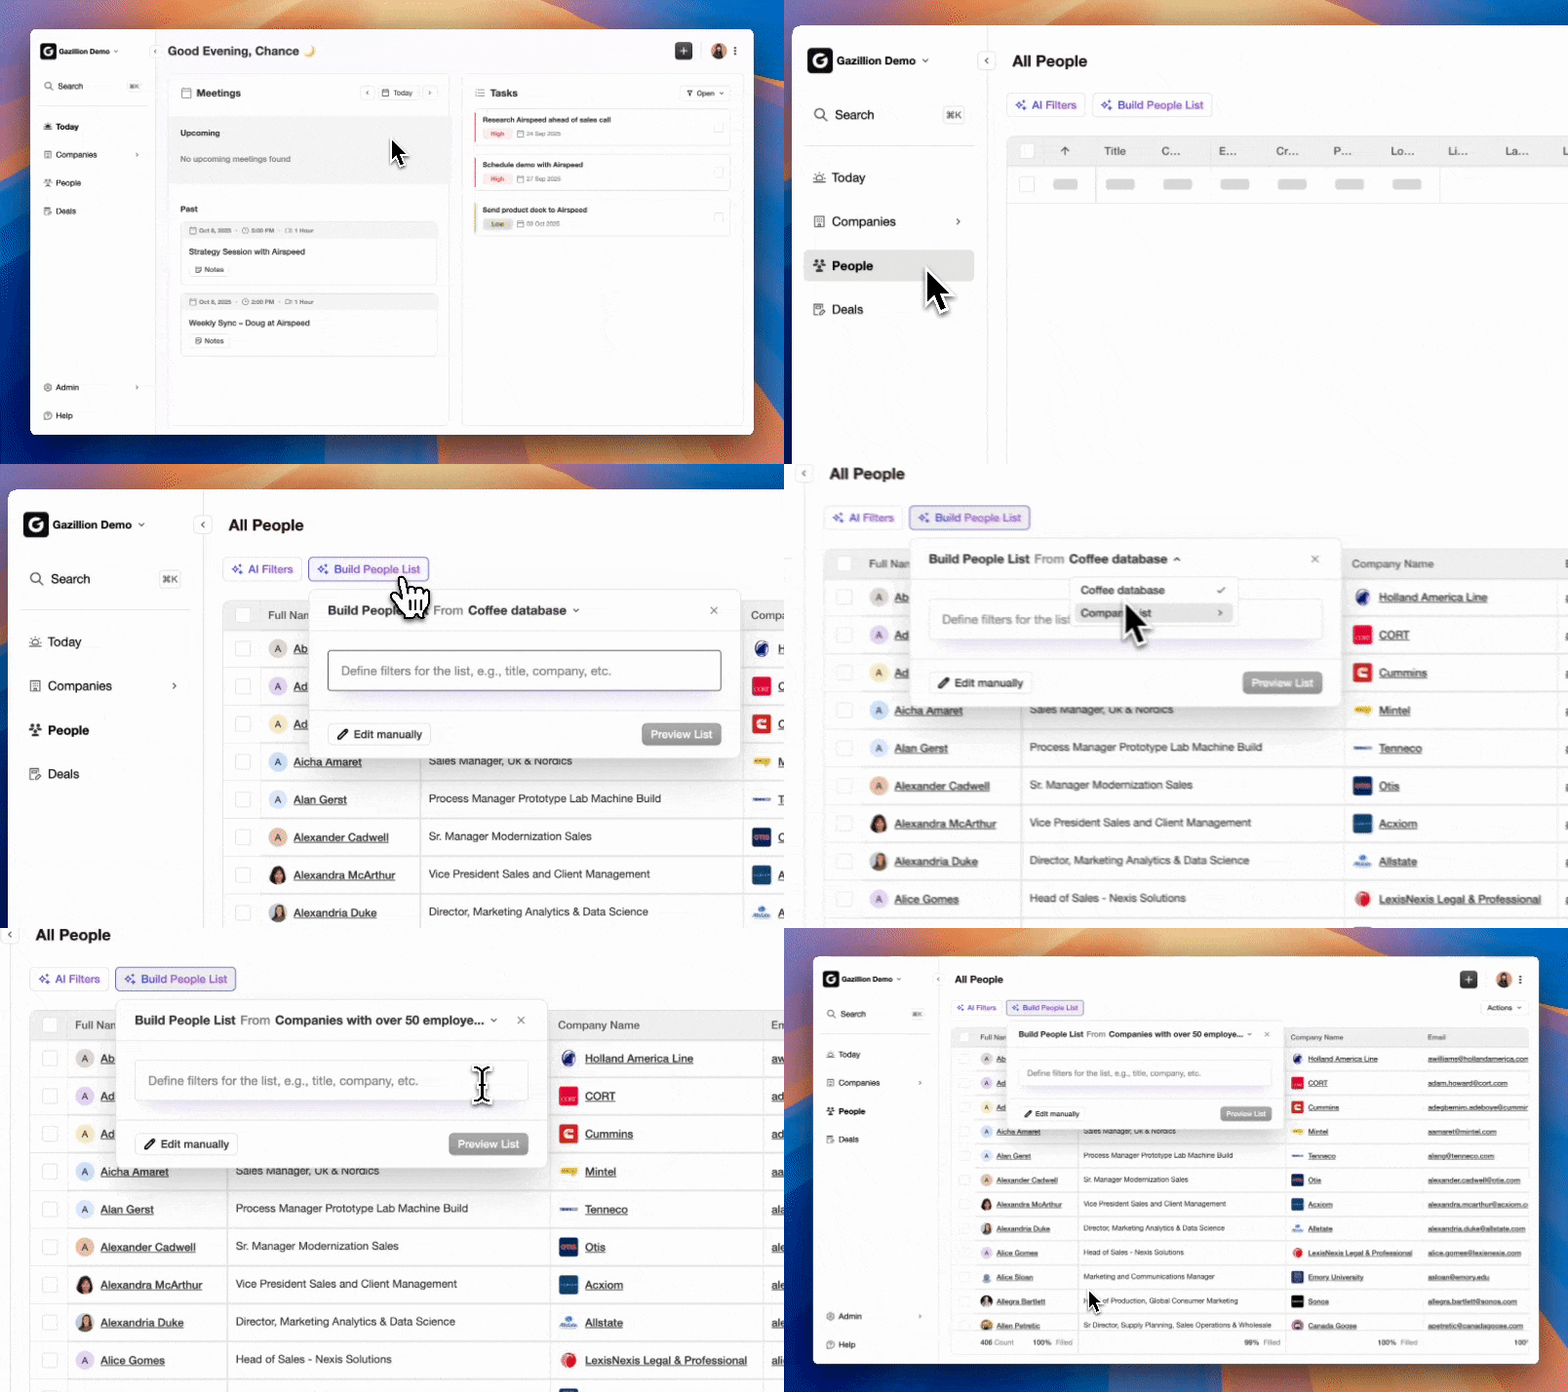
Now that the role of firmographic, technographic, and intent data is clear, Coffee's workflow shows how to execute these ideas in one place. Coffee's Lead Finder handles the firmographic filtering step natively without a separate prospecting database subscription. A sales-ops leader types a natural-language query such as “Find me VPs of Sales at SaaS companies with 50–200 employees” and Coffee's agent interprets the request, previews the matching results, and builds the list inside the same system that will enrich and sequence it.

The workflow from filter to first touch runs as follows:
- Define firmographic filters in Lead Finder, including industry, headcount band, geography, and funding stage, or use natural-language search.
- Preview the interpreted query and a sample of matching accounts before you commit the full list.
- Enrich records automatically with job titles, funding data, and LinkedIn profiles via Coffee's licensed data partners, so you avoid separate ZoomInfo or Apollo subscriptions.
- Enroll the list into Campaigns. Dynamic lists automatically add new qualifying contacts as the campaign runs, so the sequence stays current without manual CSV refreshes.
- Use AI Campaign Generation by describing the sequence in plain English so Coffee can generate subject lines, body copy, and send delays for every step, all fully editable.
- Monitor per-step stats such as emails sent and replies received, and let stop-on-reply sequencing pause automation the moment a real conversation begins.
Coffee is SOC 2 Type 2 and GDPR compliant. The platform does not use your data to train public models, which addresses the security requirements that RevOps teams at US small-to-mid-market companies face when they evaluate agentic outbound systems.
Launch your first signal-layered campaign and see how Coffee handles enrichment, sequencing, and measurement in one platform.
Rule of 7 for Buying-Signal Layering
The Rule of 7 in outbound signal layering states that an account showing seven or more distinct buying-signal touches across multiple channels within a defined window has a much higher probability of being in an active buying motion than an account with one or two signals. Buying signals are time-bound and behavior-driven events that differ from static firmographic or demographic fit. Examples include job changes, funding events, SEC filings, hiring velocity spikes, technology stack changes, social activity, and competitive intelligence.
Acting on a single intent signal in isolation is noise, not a buying signal, because a company researching a solution category could be a competitor, student, or journalist. At least two signal types should converge before you elevate an account to high priority. Stacking seven signal types across firmographic context, technographic confirmation, and behavioral triggers produces the composite account score that separates genuine Tier 1 accounts from lookalikes.
Common Firmographic Mistakes and Data Hygiene
B2B firmographic data decays more slowly than contact data, which decays at roughly 20–30% per year, and a study tracking 1,000 business contacts found that 70.8% experienced at least one change within 12 months. Annual enrichment harms pipeline quality because it allows too many records to go stale. The most common operational mistakes include:
- Over-relying on company size alone. Two 1,000-person companies in the same industry can have completely different buying capacities and decision-making processes, so size should always be combined with at least two other firmographic dimensions.
- Set-and-forget ICP definitions. Markets shift and products evolve. Re-validate ICPs quarterly by comparing firmographic attributes of closed-won versus closed-lost deals.
- Skipping suppression lists. A 2024 Gartner survey found that 73% of B2B buyers actively avoid suppliers that send irrelevant outreach, and mis-targeted sends damage sender reputation and future deliverability.
- Using global headcount instead of verified local employee count. A company with 10,000 global employees may have only 45 staff in a target market, making it a regional office rather than a true enterprise account in that geography.
- Ignoring data freshness at the field level. Quarterly re-enrichment is the minimum viable refresh cadence for active pipeline databases. Monthly or point-of-execution enrichment works better for active outreach sequences and AI agent workflows.
Coffee's SOC 2 Type 2 certification and automated enrichment pipeline address the data hygiene problem structurally. The agent continuously updates contact and company records from connected email and calendar streams, which reduces the manual enrichment burden as SDRs spend an estimated 15-30% of their time on bad or unqualified leads due to outdated or dirty data.
Measuring Firmographic Impact on Connect Rates
Connect-rate benchmarks in 2026 vary significantly by firmographic segment. Triangulated data from Cognism's State of Cold Calling 2026, Bridge Group SDR Research 2026, Salesmotion 2026, and Gong's 90,380-call dataset produces the following baseline:
| Segment | Persona | Average Connect Rate | Top-Performer Connect Rate |
|---|---|---|---|
| SMB (1–200 employees) | Managers and ICs | 15–22% | 25–30% |
| Mid-Market (201–1,000 employees) | Directors, VPs | 10–15% | 18–22% |
| Enterprise (1,000+ employees) | C-suite, Senior VPs | 5–9% | 10–14% |
KnowledgeNet.ai's analysis of 2.1 million outbound touches from 480 B2B teams shows email reply rates follow the same firmographic size pattern. SMB targets with 1–99 employees achieve a 2.1% median reply rate, mid-market targets with 100–999 employees deliver 1.4%, and enterprise targets with 1,000 or more employees show 0.8%. Programs that use tight ICP definition, demand-warmed audiences, and senior strategy often achieve higher cold email reply rates than typical industry benchmarks.
The primary measurement framework for a signal-layered firmographic program tracks four KPIs. These include intent-to-meeting rate, pipeline share from scored accounts, score-to-close velocity, and connect rate by firmographic segment benchmarked against the table above.
Frequently Asked Questions
What firmographic filters should I use first when building an outbound list?
Start with the four dimensions that most clearly distinguish your closed-won customers from the rest of your addressable market. Use industry with NAICS codes rather than free-text labels, headcount band, revenue range, and geography. These four filters, applied together, produce a universe that is specific enough to be exclusive. Add funding stage and ownership structure as secondary filters once the primary universe is sized. Avoid using company size alone because two companies with identical headcount in the same industry can have completely different buying capacities and decision-making structures. Always pair size with at least two other firmographic dimensions before you build a sequence.
How does Coffee handle firmographic data freshness and enrichment?
Coffee's agent continuously enriches contact and company records by ingesting data from connected email and calendar streams alongside licensed third-party data partners. Records update as interactions occur instead of on a manual quarterly schedule. For outbound prospecting, Coffee's Lead Finder pulls from a continuously maintained database, so the firmographic attributes attached to a list, such as headcount, industry, and funding stage, reflect current data instead of a static snapshot. Coffee is SOC 2 Type 2 and GDPR compliant, and the platform never uses your data to train public models, which addresses the security and privacy requirements that RevOps teams at US small-to-mid-market companies face when they evaluate agentic systems.
Can Coffee integrate with my existing Salesforce or HubSpot instance?
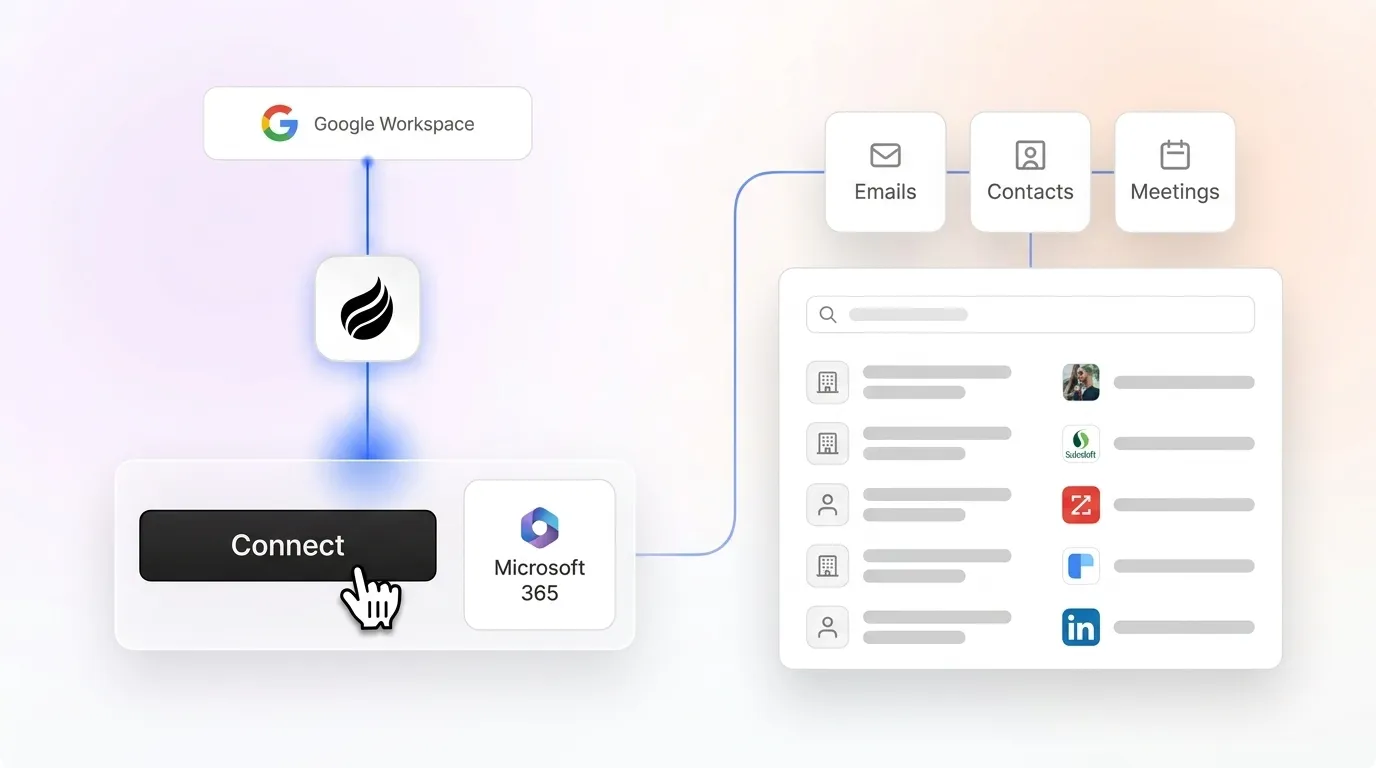
Coffee integrates with Salesforce and HubSpot through two operating modes. The platform can run as a standalone AI-first CRM for teams replacing legacy systems or as a Companion App that deploys the Coffee agent as an intelligent layer on top of an existing Salesforce or HubSpot installation. In Companion mode, a simple authentication allows the agent to sync data, enrich records, and write insights back to the primary CRM. Firmographic filters applied in Coffee's Lead Finder, along with lists and campaign stats, can flow back into the system of record your team already uses. Broader integrations beyond Salesforce and HubSpot are available via Zapier, with deeper roadmap integrations in development.
What is the difference between firmographic data and intent data for outbound prioritization?
Firmographic data describes what a company looks like structurally, including its industry, size, revenue, geography, and ownership, and it changes slowly, typically quarterly to annually. Intent data captures what a company is actively researching right now and changes daily to weekly. In outbound prioritization, firmographic filters define the eligible universe of accounts that structurally fit your ICP. Intent data, layered on top, identifies which accounts in that universe are in an active buying motion this week. Neither replaces the other. Firmographics without intent produce lists full of accounts that look correct on paper but are not ready to buy, while intent data without firmographic gating produces signals from companies that are researching your category but are not a structural fit for your product.
How many firmographic fields should a complete outbound account record contain?
A complete outbound account record for a signal-layered program typically contains 30–50 fields across identity, size, industry, revenue, geography, ownership, funding, growth signals, technographic, intent, engagement history, and suppression flags. The minimum viable set for basic ICP filtering includes six fields, which are industry, employee count, annual revenue, company location, ownership type, and company size. The extended schema adds growth-rate signals, technographic stack data, intent scores, and CRM engagement history to support composite account scoring and dynamic list enrollment. Field completeness rates matter as much as field count because a record with 50 fields where 30 are empty produces worse segmentation than a record with 15 fully populated, verified fields.
Conclusion: Turning Firmographic Insight into Outbound Motion
Firmographic data forms the foundation of every effective outbound program, but it does not represent the complete structure. The 2026 outbound model uses firmographic filters to define the eligible account universe, technographic signals to confirm compatibility, and intent data to identify timing. Teams then activate the resulting prioritized list inside a single agentic system that sequences, enriches, and measures without CSV exports or extra tool subscriptions. Coffee's Lead Finder and Campaigns workflow executes this entire motion natively, from natural-language ICP query to dynamic, signal-layered list to automated multi-step sequence, all inside one SOC 2 Type 2 certified platform built for US small-to-mid-market B2B teams.
Start building your ICP-filtered outbound program with Coffee's Lead Finder and Campaigns workflow today.