Written by: Doug Camplejohn, CEO & Co-Founder, Coffee | Last updated: July 28, 2026
Key Takeaways for ABM ROI in 2026
- CFOs expect a clear ABM ROI number, not vague pipeline influence, so accurate CRM data becomes the main operational risk for RevOps leaders.
- The five-step calculation process stays accurate only when CRM inputs are complete and reliable at every step.
- Common CRM failures, including missing timestamps, duplicate records, stale contacts, unlogged meetings, and incomplete stage history, directly corrupt specific parts of the ROI formula.
- Top-performing ABM programs often reach 7:1 pipeline ROI while average programs land closer to 3:1, with meaningful gains in win rate and deal velocity on target accounts.
- Coffee automates the data capture that prevents every one of these failures, so see how Coffee eliminates these data-quality risks and makes every ABM ROI calculation defensible from day one.
Defining ABM ROI for Finance and RevOps
ABM ROI is the net financial return generated by a targeted, account-level marketing program, expressed as a ratio or percentage of total program investment. You calculate it by isolating revenue closed from a defined set of target accounts, subtracting all associated program costs, and dividing the result by those costs. A defensible ABM ROI figure depends on a clean baseline, a consistent attribution window, and account-level CRM data that accurately reflects every touchpoint across the buying committee.
The five steps to calculate ABM ROI are:
- Define total program cost across all input categories.
- Establish a pre-ABM baseline for win rate, deal size, and velocity.
- Apply account-level multi-touch attribution to closed-won revenue.
- Measure the lift against the baseline.
- Calculate net ROI using the standard formula.
Each of these steps depends on specific CRM data inputs and carries a clear failure mode when that data is incomplete. The detailed breakdown below explains the operational requirements, source systems, and data-quality risks for every step.
Steps 1–5: The Attribution Calculation in Practice
- Define Total Program Cost. Input: all fixed and variable spend. Source systems: finance ERP, vendor invoices, HR for headcount allocation. Owner: RevOps or Finance. A complete ABM investment includes ABM platform costs, enrichment and data tools, advertising spend, content creation, headcount allocation as a percentage of marketing and sales time, and events or experiences for target accounts. Headcount is typically the largest cost category, which is why excluding it inflates reported ROI, since teams often omit it when it is harder to quantify than vendor invoices. When CRM activity logs are incomplete, even teams that try to include headcount rely on guesses instead of actuals, which understates the cost denominator and overstates ROI.
- Establish a Pre-ABM Baseline. Input: historical win rate, average contract value (ACV), and days-to-close for non-ABM accounts. Source system: CRM opportunity history. Owner: RevOps. Teams that skip a baseline often overstate ROI because they cannot show a credible “before” picture. When stage-history fields in the CRM are missing or overwritten, you lose the ability to reconstruct a valid baseline, and the lift calculation becomes impossible to defend.
- Apply Account-Level Multi-Touch Attribution. Input: every touchpoint from every contact at each target account, resolved to a single account record. Source system: CRM plus marketing automation plus call recording. Owner: Marketing Ops. Account-level multi-touch attribution works by capturing every touchpoint from every contact across channels, resolving identities, rolling contacts up to a single account and opportunity, applying a multi-touch model such as W-shaped or U-shaped, and reconciling credit against actual closed-won revenue to avoid double-counting. Native Salesforce attribution relies on Contact Roles attached to opportunities, and missing roles silently produce zero attribution for those contacts with no error message, which forces manual entry that frequently fails and hides real influence.
- Measure Lift Against the Baseline. Input: ABM cohort win rate, ACV, and days-to-close versus the baseline established in Step 2. Source system: CRM reporting. Owner: RevOps. A reasonable year-one target is a double-digit improvement in win rate and deal velocity, with the 15–20% and 10–15% benchmarks mentioned earlier providing a concrete reference point. Duplicate account records split engagement signals across records, which makes the ABM cohort appear smaller and the lift appear lower than it actually is.
- Calculate Net ROI. Input: ABM-attributed closed-won revenue and total program cost from Step 1. Formula: (ABM Revenue – Total Program Cost) ÷ Total Program Cost × 100. Source system: CRM closed-won report. Owner: RevOps or Finance. These results should align with the 7:1 and 3:1 benchmarks referenced earlier when the program and data foundation are mature. Unlogged meetings and missing timestamps cause revenue to be attributed to the wrong period or excluded entirely, which understates the numerator and weakens the ROI story.
2026 ABM ROI Formula Reference Table
The table below defines each variable in the ROI formula and maps it to the source system where teams pull the data. Use this as a quick reference when you build or audit your ABM measurement dashboard.
| Variable | Definition | Source System |
|---|---|---|
| ABM Revenue (R) | Closed-won ARR attributed to target accounts within the measurement window | CRM closed-won report |
| Total Program Cost (C) | Platform + enrichment + ad spend + content + headcount + events | Finance ERP + vendor invoices |
| Net Return | R – C | Calculated field |
| ROI % | (R – C) ÷ C × 100 | Calculated field |
2026 Benchmarks: ABM vs. Non-ABM Performance
Use the benchmarks below to set realistic ROI targets for your program tier. These ranges reflect 18-month performance across many B2B programs and should guide your planning and CFO conversations.
| ABM Program Type | Expected ROI Range (18 months) | Win Rate vs. Non-ABM |
|---|---|---|
| One-to-one (10–50 accounts) | 5:1 to 10:1 | 2–3x higher win rates on target accounts vs. non-ABM pipeline (12–18 months to materialize) |
| One-to-few (50–250 accounts) | 3:1 to 6:1 | |
| One-to-many (250–2,500 accounts) | 2:1 to 4:1 | |
| Programmatic (2,500+ accounts) | 1.5:1 to 3:1 |
Outcomes Rocket research based on a study of 771 marketers estimates average ABM ROI at 137%, with nearly half of respondents citing ABM as their highest source of ROI. High-performing ABM teams that implement monthly contact hygiene sweeps and quarterly buying-committee re-mapping typically lift program ROI by 20% to 40% in the first two quarters. These outcomes depend on accurate CRM data, which connects directly to the data-quality risks in the next section.
How Poor CRM Data Destroys ABM ROI
Each of the five calculation steps above has a specific data dependency, and failures in those inputs quietly erode ROI. The five most common CRM failures and their quantified revenue impact are:
- Missing timestamps on activities. When call and meeting timestamps are not logged, Step 3 attribution cannot assign credit to the correct period. Revenue is either excluded from the measurement window or double-counted across quarters, which corrupts the numerator of the ROI formula.
- Duplicate account records. Duplicate rates of 10-30% are common in ungoverned CRMs. When a single account exists as multiple records, engagement signals such as emails, calls, and meetings are logged against whichever record the rep uses, which splits the activity history across duplicates. As a result, the ABM cohort in Step 4 appears smaller than it really is because some target accounts look disengaged when their activity sits on a duplicate record, and this suppresses measured lift by a proportional margin.
- Stale job titles and contacts. B2B contact data decays at approximately 30% per year. When buying committee members change roles, Step 3 multi-touch attribution routes credit to former employees, and the committee coverage metric used in Step 4 becomes overstated.
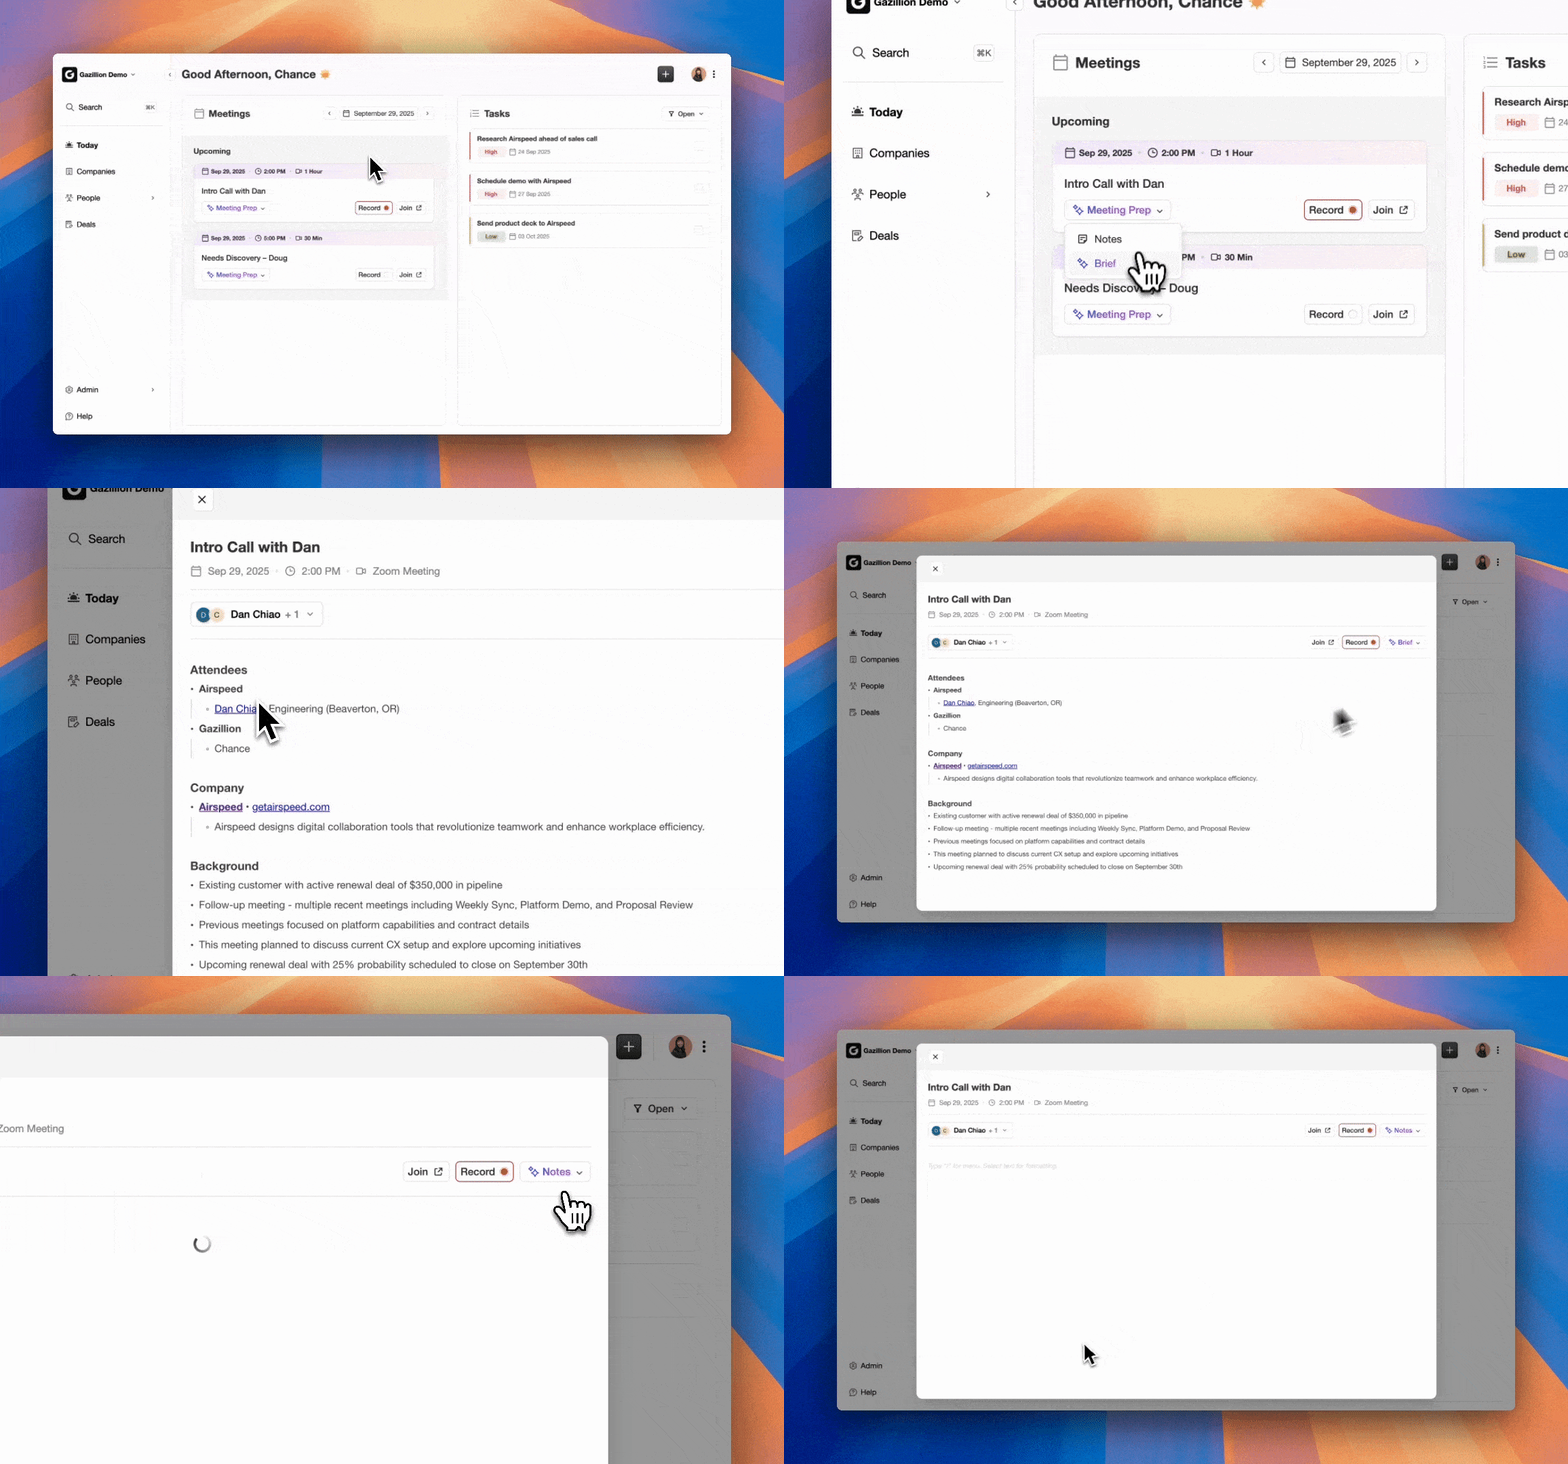
- Unlogged meetings. As noted in Step 3, missing Contact Roles eliminate attribution for entire contacts. Every unlogged sales meeting becomes a touchpoint that disappears from the attribution model, which understates marketing influence and distorts the sourced-versus-influenced split that the CFO will review closely.
- Incomplete stage history. Overwritten stage fields remove the ability to reconstruct the baseline required in Step 2. Without a valid baseline, ROI is often overstated, and that figure will not survive a finance audit.
30-Day Implementation Checklist for a CFO-Ready ROI Deck
The sequence below walks your team from messy CRM data to a CFO-ready ROI deck in 30 days.
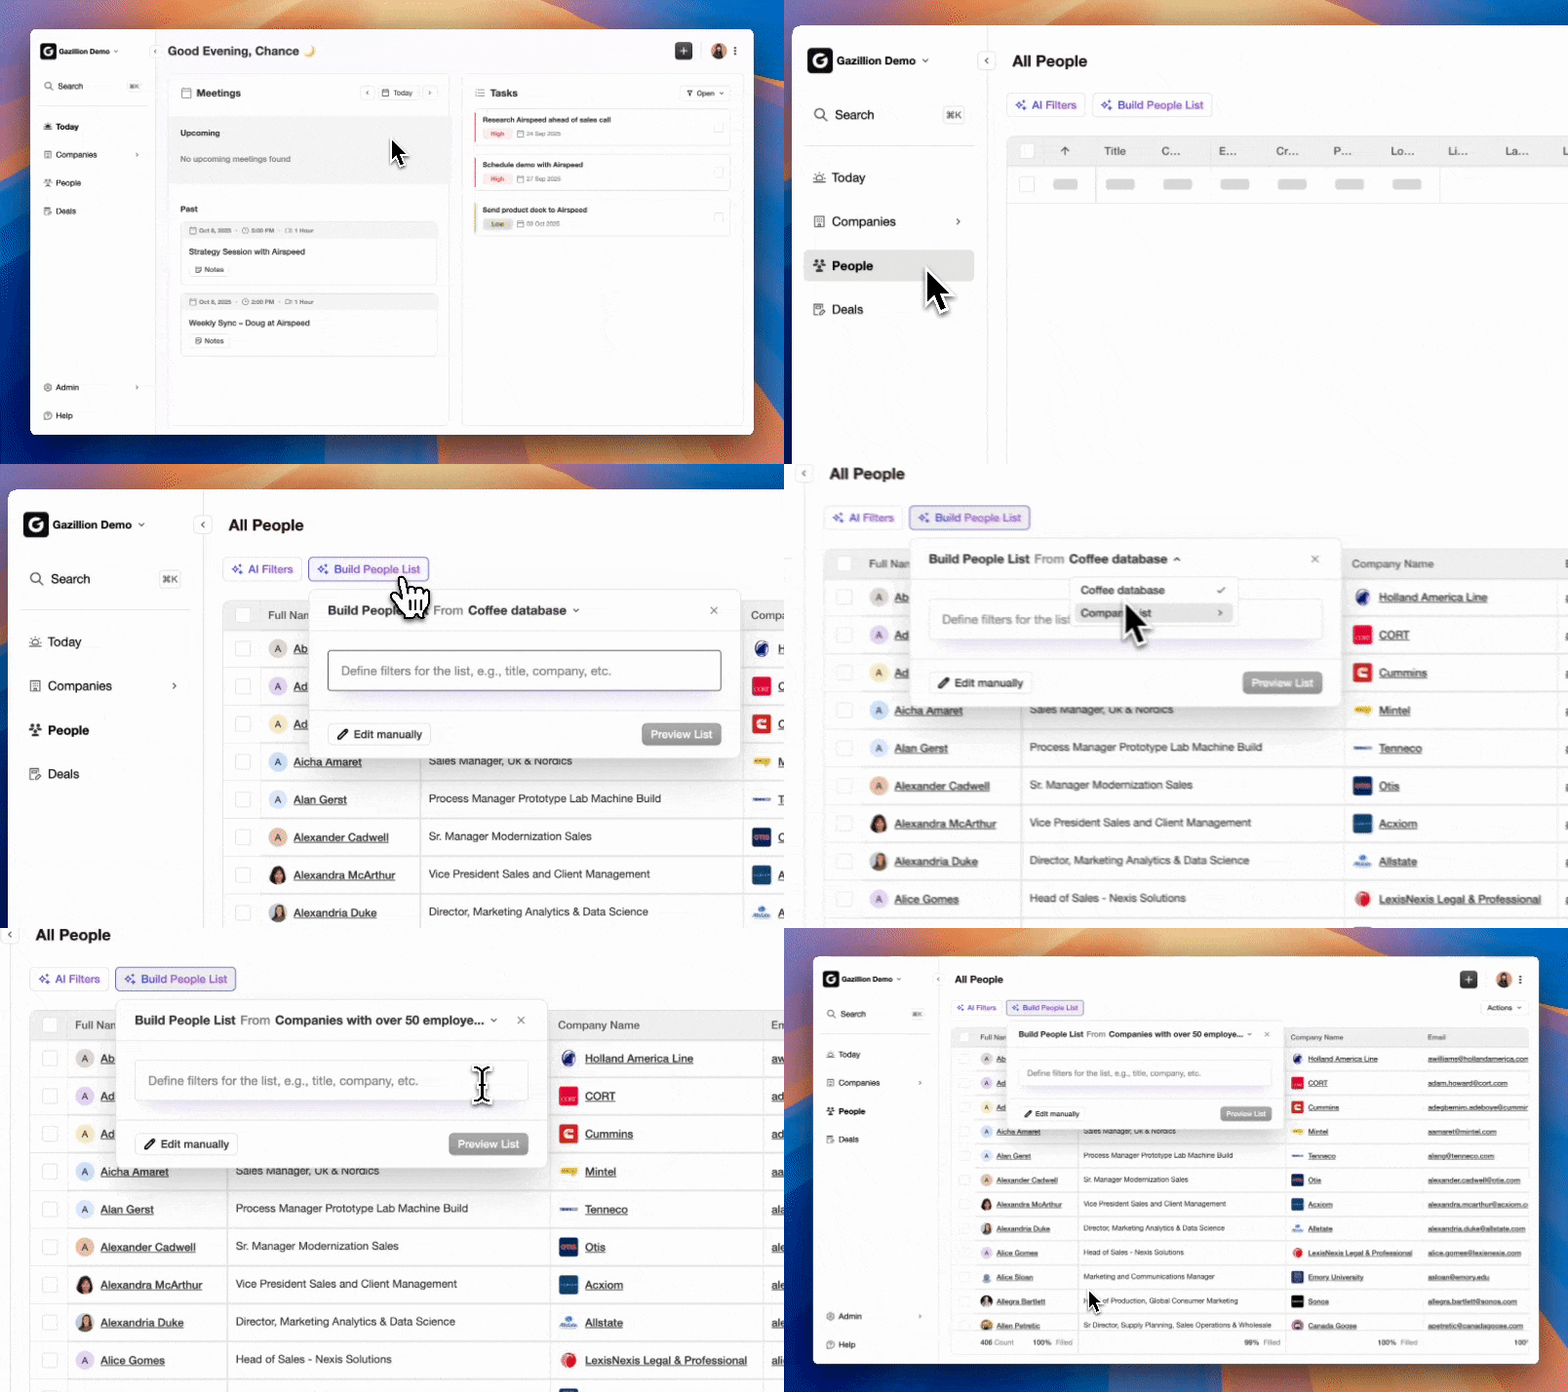
- Days 1–3: Audit CRM completeness. Pull a report of all target accounts. Flag records missing primary contact, job title, last activity date, opportunity stage history, and Contact Role assignments on open opportunities.
- Days 4–7: Deduplicate account records. Run a domain-based deduplication pass. Merge or suppress duplicate records before any attribution query runs, and assign a primary domain as the universal match key between CRM and ABM platform.
- Days 8–10: Backfill missing activity logs. Cross-reference calendar and email data against CRM activity records, then manually log any meetings, calls, or email threads not yet captured. This manual backfill is time-intensive and error-prone, which is why an autonomous CRM agent like Coffee delivers high ROI at this step by capturing every activity automatically from day one.
- Days 11–14: Establish the pre-ABM baseline. Query closed-won opportunities from the 12 months prior to ABM program launch. Record median win rate, median ACV, and median days-to-close for non-target accounts, and store this as a locked reference dataset.
- Days 15–18: Define the attribution window and model. Set attribution windows of 90 to 365 days to capture the full committee journey. Select a W-shaped or full-path model, and document the model choice so the CFO can review and audit the methodology.
- Days 19–22: Pull total program cost. Collect actuals from finance, including platform subscriptions, ad spend, content invoices, and headcount allocation. Avoid rough headcount estimates and use logged activity data to calculate actual time spent.
- Days 23–26: Run the five-step ROI calculation. Apply the formula table above. Segment results by ABM program tier, such as one-to-one, one-to-few, and one-to-many, to show the CFO where capital is most efficiently deployed.
- Days 27–30: Build the CFO deck. Structure the presentation around four slides: methodology and data sources, baseline versus ABM cohort comparison, ROI by program tier, and the data-quality actions taken with the ongoing governance plan.
Frequently Asked Questions
What cost inputs are most commonly omitted from ABM ROI calculations?
The two most frequently omitted cost categories are headcount allocation and internal opportunity cost. Headcount, meaning the percentage of marketing, SDR, and sales time dedicated to ABM activities, is usually the largest single line item in an ABM budget, yet many teams exclude it because it requires pulling time-tracking or activity data from the CRM instead of a vendor invoice. Opportunity cost, which reflects the revenue or pipeline that could have been generated by deploying the same resources on non-ABM programs, is harder to quantify but should still be acknowledged in any CFO presentation. A complete cost model covers ABM platform and intent data subscriptions, enrichment tools, paid media, content production, events and executive experiences, agency or freelance fees, and the prorated salary cost of every team member whose time is materially allocated to the program.
What attribution window should B2B teams use for ABM ROI measurement?
The appropriate attribution window for most B2B ABM programs ranges from 90 to 365 days, calibrated to the actual average sales cycle length for target accounts. Shorter windows of 7 or 30 days come from demand-generation measurement and do not fit ABM, where buying committees of six to ten stakeholders research independently over months before an opportunity is created. Using a short window discards early-stage touches that often drive enterprise deals. Teams should set the window at program launch, document it formally, and hold it constant across measurement periods so that year-over-year comparisons remain valid. When the sales cycle for Tier 1 accounts averages nine months, the attribution window should be at least nine months, with a 12-month window preferred to capture late-stage re-engagement.
How should a team scale ABM ROI measurement from a pilot to a full program?
A pilot program of 10 to 50 accounts should operate as a controlled experiment. The pilot cohort and a matched holdout group of similar non-ABM accounts should be defined before the program launches, with baseline win rate, ACV, and days-to-close recorded for both groups. At the end of the pilot measurement window, the five-step ROI calculation runs on the ABM cohort and is compared against the holdout. When the pilot produces a defensible lift, typically a 15% or greater improvement in win rate and a measurable reduction in days-to-close, the methodology, attribution model, and data governance process can then be replicated at scale. The critical scaling risk is data quality, because a 50-account pilot can be manually audited while a 500-account program cannot, so autonomous CRM data capture must be in place before scaling or the measurement framework will degrade with program size.
Conclusion: Making ABM ROI Defensible Every Quarter
The five-step ABM ROI process above is arithmetically straightforward, yet the operational challenge lies in guaranteeing that every input, including activity timestamps, contact roles, stage history, headcount logs, and account deduplication, is accurate before the calculation runs. Manual CRM entry cannot meet that standard at scale, which creates a measurement gap rather than a program gap. Coffee acts as the autonomous CRM agent that closes this gap by automatically logging every meeting, call, email, and activity directly into the system of record, which removes the manual entry failures that invalidate each step of the attribution process. With clean data guaranteed by the agent, the CFO-ready ROI deck becomes a repeatable output instead of a quarterly scramble.
Make every ABM ROI calculation defensible, and start your Coffee trial today.